> For the complete documentation index, see [llms.txt](https://docs.panther.com/llms.txt). Markdown versions of documentation pages are available by appending `.md` to page URLs; this page is available as [Markdown](https://docs.panther.com/~/changes/15ann7vKLltCCAGHtdQr/search/panther-fields.md).

# Standard Fields

Panther's log analysis applies normalization fields (IPs, domains, etc) to all log records. These fields provide standard names for attributes across all data sources enabling fast and easy data correlation.

For example, each data source has a time that an event occurred, but each data source will likely not name the attribute the same, nor is it guaranteed that the associated time has a timezone consistent with other data sources.

The Panther attribute `p_event_time` is mapped to each data source's corresponding event time and normalized to UTC. This way you can query over multiple data sources joining and ordering by `p_event_time` to properly align and correlate the data despite the disparate schemas of each data source.

{% hint style="info" %}
All appended standard fields begin with `p_`
{% endhint %}

## Required Fields

The fields below are appended to all log records:

<table data-header-hidden><thead><tr><th width="227.35377358490564">Field Name</th><th width="150.8477048821628">Type</th><th>Description</th></tr></thead><tbody><tr><td><strong>Field Name</strong></td><td><strong>Type</strong></td><td><strong>Description</strong></td></tr><tr><td><code>p_log_type</code></td><td><code>string</code></td><td>The type of log.</td></tr><tr><td><code>p_row_id</code></td><td><code>string</code></td><td>Unique id (UUID) for the row.</td></tr><tr><td><code>p_event_time</code></td><td><code>timestamp</code></td><td>The associated event time for the log type is copied here and normalized to UTC.<br><br>Format: <code>YYYY-MM-DD HH:MM:SS.fff</code></td></tr><tr><td><code>p_parse_time</code></td><td><code>timestamp</code></td><td>The current time when the event was parsed, normalized to UTC.<br><br>Format: <code>YYYY-MM-DD HH:MM:SS.fff</code></td></tr><tr><td><code>p_schema_version</code></td><td><code>integer</code></td><td>The version of the schema used for this row.</td></tr><tr><td><code>p_source_id</code></td><td><code>string</code></td><td>The Panther generated internal id for the source integration.</td></tr><tr><td><code>p_source_label</code></td><td><code>string</code></td><td>The user supplied label for the source integration (may change if edited).</td></tr></tbody></table>

{% hint style="info" %}
If an event does not have a timestamp, then `p_event_time` will be set to `p_parse_time`, which is the time the event was parsed.
{% endhint %}

The `p_source_id` and `p_source_label` fields are very useful for knowing where the data originated. For example, you might have multiple CloudTrail sources registered with Panther, each with a unique name (e.g., "Dev Accounts", "Production Accounts", "HR Accounts", etc.). These fields allow you to easily separate data based on the source which can be very useful to use in Panther rules as well as business intelligence (BI) reporting.

In addition, the fields below are appended to log records of all tables in the `panther_rule_matches` database:

<table data-header-hidden><thead><tr><th width="279.2877939529675">Field Name</th><th width="195.33333333333334">Type</th><th>Description</th></tr></thead><tbody><tr><td><strong>Field Name in panther_rule_matches</strong></td><td><strong>Type</strong></td><td><strong>Description</strong></td></tr><tr><td><code>p_alert_id</code></td><td><code>string</code></td><td>Id of alert related to row.</td></tr><tr><td><code>p_alert_creation_time</code></td><td><code>timestamp</code></td><td>Time of alert creation related to row.</td></tr><tr><td><code>p_alert_context</code></td><td>object</td><td>A JSON object returned from the rule's alert_context() function.</td></tr><tr><td><code>p_alert_severity</code></td><td><code>string</code></td><td>The severity level of the rule at the time of the alert. This could be different from the default severity as it can be dynamically set.</td></tr><tr><td><code>p_alert_update_time</code></td><td><code>timestamp</code></td><td>Time of last alert update related to row.</td></tr><tr><td><code>p_rule_id</code></td><td><code>string</code></td><td>The id of the rule that generated the alert.</td></tr><tr><td><code>p_rule_error</code></td><td><code>string</code></td><td>The error message if there was an error running the rule.</td></tr><tr><td><code>p_rule_reports</code></td><td><code>map[string]array[string]</code></td><td>List of user defined rule reporting tags related to row.</td></tr><tr><td><code>p_rule_severity</code></td><td><code>string</code></td><td>The default severity of the rule.</td></tr><tr><td><code>p_rule_tags</code></td><td><code>array[string]</code></td><td>List of user defined rule tags related to row.</td></tr></tbody></table>

## Indicator Fields

A common security question is, “Was `some indicator` ever observed in *any* of our logs?” Panther's [Indicator Search](/~/changes/15ann7vKLltCCAGHtdQr/search/indicator-search.md) enables you to find the answer by searching across data from all of your various log sources.

As log events are ingested, the [`indicators` field](/~/changes/15ann7vKLltCCAGHtdQr/data-onboarding/custom-log-types/reference.md#indicators) in their corresponding schema identifies which fields should have their values extracted into `p_any_` fields, which are appended to and stored with the event. The table below shows which `p_any_` field(s) data is extracted into, by `indicator`.

When constructing a custom schema, you can use the values in the Indicator Name column in the table below in your schema's [`indicators` field](/~/changes/15ann7vKLltCCAGHtdQr/data-onboarding/custom-log-types/reference.md#indicators). Each of the rows (except for `hostname`, `net_addr`, and `url`) corresponds to a value in [Indicator Search's Field dropdown](/~/changes/15ann7vKLltCCAGHtdQr/search/indicator-search.md#field-selection).&#x20;

Note that field name/value pairs outside of the fields in the table below can be searched with Indicator Search's [Simple Search](/~/changes/15ann7vKLltCCAGHtdQr/search/indicator-search.md#simple-search) functionality—though because those fields have not been mapped to corresponding ones (with different syntax) in different log sources, only matches from log sources containing the exact field name searched will be returned.

<table><thead><tr><th width="178.33333333333331">Indicator Name</th><th width="213.67435158501445">Extracted into fields</th><th>Description</th></tr></thead><tbody><tr><td>actor_id</td><td>p_any_actor_ids</td><td>Append value to p_any_actor_ids.</td></tr><tr><td>aws_account_id</td><td>p_any_aws_account_ids</td><td>If the value is a valid AWS account id then append to p_any_aws_account_ids.</td></tr><tr><td>aws_arn</td><td>p_any_aws_arns,<br>p_any_aws_instance_ids,<br>p_any_aws_account_ids,<br>p_any_emails<br></td><td>If value is a valid AWS ARN then append to p_any_aws_arns.<br>If the ARN contains an AWS account id, extract and append to p_any_aws_account_ids.<br>If the ARN contains an EC2 instance id, extract and append to p_any_aws_instance_ids.<br>If the ARN references an AWS STS Assume Role and contains and email address, then extract email address into p_any_emails.<br></td></tr><tr><td>aws_instance_id</td><td>p_any_aws_instance_ids</td><td>If the value is a valid AWS instance id then append to p_any_aws_instance_ids.</td></tr><tr><td>aws_tag</td><td>p_any_aws_tags</td><td>Append value into p_any_aws_tags.</td></tr><tr><td>domain</td><td>p_any_domain_names</td><td>Append value to p_any_domain_names.</td></tr><tr><td>email</td><td>p_any_emails</td><td>If value is a valid email address then append value into p_any_emails.</td></tr><tr><td>hostname</td><td>p_any_domain_names, p_any_ip_addresses</td><td>Append value to p_any_domain_names.<br>If value is a valid ipv4 or ipv6 address then append to p_any_ip_addresses.</td></tr><tr><td>ip</td><td>p_any_ip_addresses</td><td>If value is a valid ipv4 or ipv6 address then append to p_any_ip_addresses.</td></tr><tr><td>mac</td><td>p_any_mac_addresses</td><td>If a value is a valid IEEE 802 MAC-48, EUI-48, EUI-64, or a 20-octet IP over InfiniBand link-layer address then append to p_any_mac_addresses.</td></tr><tr><td>md5</td><td>p_any_md5_hashes</td><td>If the value is a valid md5 then append value into p_any_md5_hashes.</td></tr><tr><td>net_addr</td><td>p_any_domain_names, p_any_ip_addresses</td><td>Extracts from values of the form &#x3C;host>:&#x3C;port>.<br>Append host portion to p_any_domain_names.<br>If host portion  is a valid ipv4 or ipv6 address then append to p_any_ip_addresses.</td></tr><tr><td>serial_number</td><td>p_any_serial_numbers</td><td><p>Append value to p_any_serial_numbers.<br></p><p>This feature is in closed beta starting with Panther version 1.69. To share any bug reports or feature requests, please contact your Panther support team.</p></td></tr><tr><td>sha1</td><td>p_any_sha1_hashes</td><td>If the value is a valid sha1 then append to p_any_sha1_hashes.</td></tr><tr><td>sha256</td><td>p_any_sha256_hashes</td><td>If the value is a valid sha256 then append to p_any_sha256_hashes.</td></tr><tr><td>trace_id</td><td>p_any_trace_ids</td><td>Append value to p_any_trace_ids. <br>Tag fields such as session ids and document ids that are used to associated elements with other logs in order to trace the full activity of a sequence of related events.</td></tr><tr><td>url</td><td>p_any_domain_names, p_any_ip_addresses</td><td><p>Parse url, extract the host portion after "http://" or "https://".<br></p><p>Append host portion to p_any_domain_names.<br>If host portion is a valid ipv4 or ipv6 address then append to p_any_ip_addresses.</p></td></tr><tr><td>username</td><td>p_any_usernames</td><td>Append value into p_any_usernames.</td></tr></tbody></table>

## Enrichment Fields <a href="#enrichmentfields" id="enrichmentfields"></a>

The Panther rules engine will take the looked up matches from [Lookup Tables ](/~/changes/15ann7vKLltCCAGHtdQr/enrichment/lookup-tables.md)and append that data to the event using the key `p_enrichment` in the following JSON structure:

```json
{ 
    'p_enrichment': {
        <name of lookup table>: { 
            <key in log that matched>: <matching row looked up>,
            ...
	    <key in log that matched>: <matching row looked up>,
        }    
    }
} 
```

<table><thead><tr><th width="250">Enrichment Field Name</th><th width="122.33333333333331">Type</th><th>Description of Enrichment Field</th></tr></thead><tbody><tr><td><code>p_enrichment</code></td><td>object</td><td>Dictionary of lookup results where matching rows were found.</td></tr><tr><td><code>p_match</code></td><td>string</td><td><code>p_match</code> is injected into the data of each matching row within <code>p_enrichment</code>. Its value is the value that matched in the event.</td></tr></tbody></table>

## The "all\_logs" View

Panther manages a view over all data sources with standard fields.

This allows you to ask questions such as "was there *any* activity from some-bad-ip and if so where?".

The query below will show how many records (by log type) are associated with IP address `95.123.145.92`:

{% tabs %}
{% tab title="Snowflake" %}

```sql
SELECT
 p_log_type, count(1) AS row_count
FROM panther_views.public.all_logs
WHERE p_occurs_between('2020-1-30', '2020-1-31')
     AND array_contains('95.123.145.92'::variant, p_any_ip_addresses)
GROUP BY p_log_type
```

{% endtab %}

{% tab title="Athena" %}

```sql
SELECT
 p_log_type, count(1) AS row_count
FROM panther_views.all_logs
WHERE p_occurs_between('2020-1-30', '2020-1-31') 
     AND contains(p_any_ip_addresses, '95.123.145.92')
GROUP BY p_log_type
```

{% endtab %}
{% endtabs %}

From these results, you can pivot to the specific logs where activity is indicated.

## Standard Fields in Rules

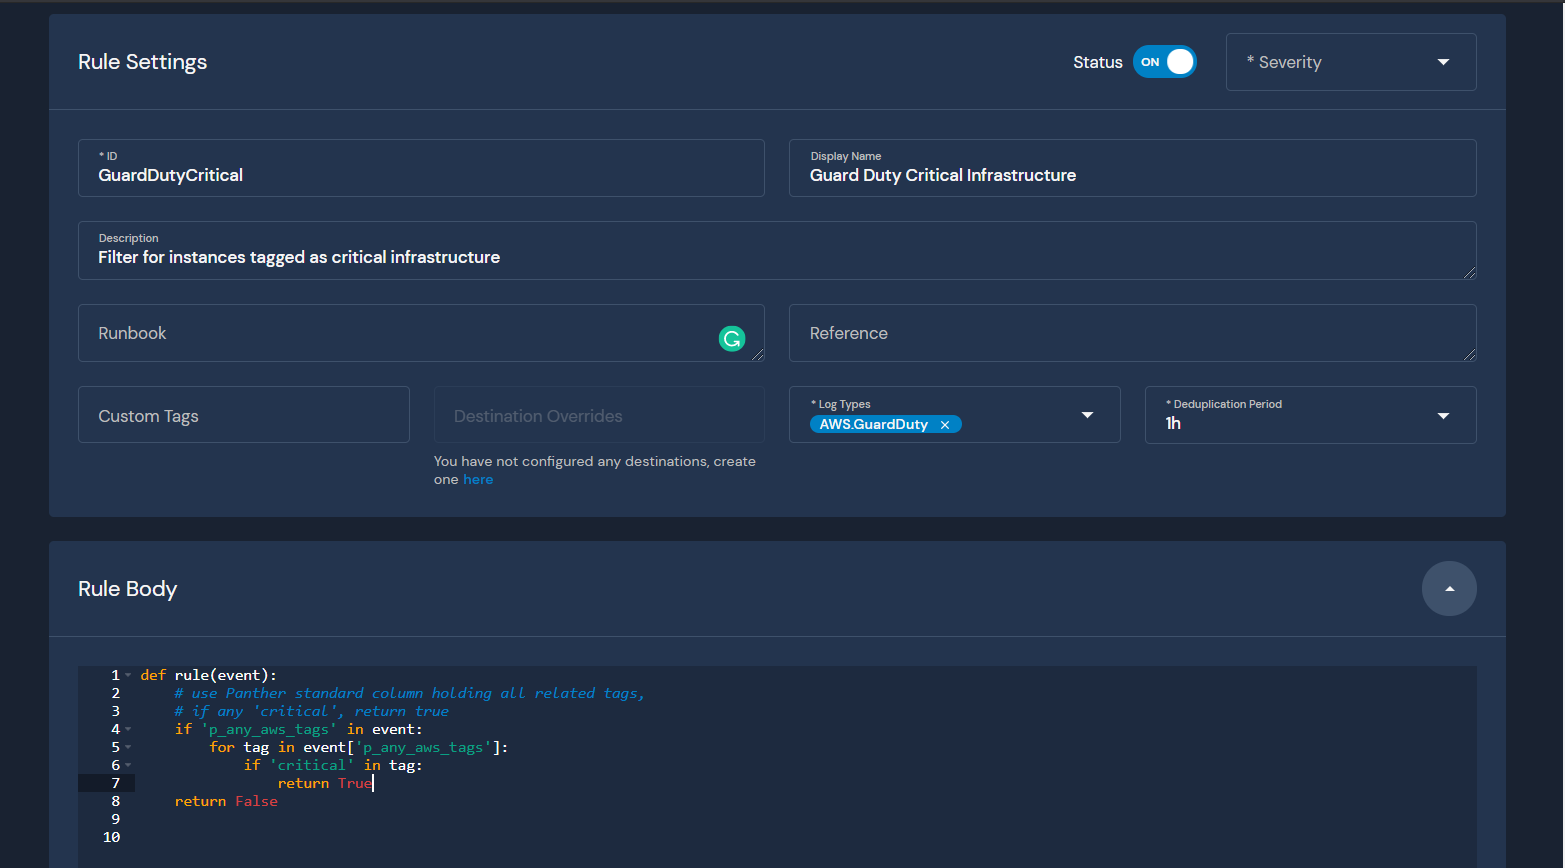
The Panther standard fields can be used in rules. For example, this rule triggers when any GuardDuty alert is on a resource tagged as 'critical':

<figure><img src="https://4011785613-files.gitbook.io/~/files/v0/b/gitbook-legacy-files/o/assets%2F-LgdiSWdyJcXPahGi9Rs%2Fsync%2Fa8be2e21c69819777794958601cfc79937751924.png?generation=1595976055714197&amp;alt=media" alt="An example rule in Panther that triggers when any GuardDuty alert is on a resource tagged as critical"><figcaption><p>Example Panther Rule</p></figcaption></figure>


---

# Agent Instructions
This documentation is published with GitBook. GitBook is the documentation platform designed so that both humans and AI agents can read, navigate, and reason over technical content effectively. Learn more at gitbook.com.

## Querying This Documentation
If you need additional information that is not directly available in this page, you can query the documentation dynamically by asking a question.

Perform an HTTP GET request on the current page URL with the `ask` query parameter, and the optional `goal` query parameter:

```
GET https://docs.panther.com/~/changes/15ann7vKLltCCAGHtdQr/search/panther-fields.md?ask=<question>&goal=<endgoal>
```

`ask` is the immediate question: it should be specific, self-contained, and written in natural language.
`goal` is optional and describes the broader end goal you are ultimately trying to accomplish on behalf of the user. GitBook uses it to tailor the answer towards what is most useful for that goal.

The response will contain a direct answer to the question and relevant excerpts and sources from the documentation.

Use this mechanism when the answer is not explicitly present in the current page, you need clarification or additional context, or you want to retrieve related documentation sections.