> For the complete documentation index, see [llms.txt](https://docs.panther.com/llms.txt). Markdown versions of documentation pages are available by appending `.md` to page URLs; this page is available as [Markdown](https://docs.panther.com/ko/pantherflow/example-queries/threat-hunting.md).
# PantherFlow 예시: 위협 헌팅 시나리오
## 알러트에서 로그 검색으로 피벗하기
수신했다고 가정해 보겠습니다 [Wiz](broken://pages/fcac338bacf953ccd5a49609e4a2c00cf3d4dd6b) EC2 인스턴스가 잠재적으로 잘못 구성되었다는 알러트입니다. 알러트에서 연결된 AWS 인스턴스 ID를 가져올 수 있습니다. 그런 다음 해당 인스턴스의 활동을 찾기 위해 모든 AWS 로그를 검색할 수 있습니다.
```kusto
let 알러트_data = panther_signals.public.signal_알러트s
| where p_event_time > time.ago(7d)
| where p_알러트_id == '00411934608291e0fccd928590194fd6'
| summarize instances = arrays.flatten(agg.make_set(p_any_aws_instance_ids)),
mintime = agg.min(p_event_time),
maxtime = agg.max(p_event_time);
union panther_logs.public.aws*
| where p_event_time between time.parse_timestamp(toscalar(알러트_data | project mintime)) - 30m
.. time.parse_timestamp(toscalar(알러트_data | project maxtime)) + 30m
| where arrays.overlap(p_any_aws_instance_ids, toscalar(알러트_data | project instances))
```
위 구문은 다음을 활용합니다:
* [`let` 구문](/ko/pantherflow/statements.md#let-statements) 기능
* 연산자: [`union`](/ko/pantherflow/operators/union.md), [`project`](/ko/pantherflow/operators/project.md), [`summarize`](/ko/pantherflow/operators/summarize.md), [`where`](/ko/pantherflow/operators/where.md), 그리고 [`between`](/ko/pantherflow/expressions.md#between-comparisons)
* 함수: [`arrays.flatten()`](https://docs.panther.com/ko/pantherflow/example-queries/pages/c58ae0e898fd6f293efee986d6d1707148384f17#arrays.flatten), [`arrays.overlap()`](https://docs.panther.com/ko/pantherflow/example-queries/pages/c58ae0e898fd6f293efee986d6d1707148384f17#arrays.overlap), [`agg.make_set()`](https://docs.panther.com/ko/pantherflow/example-queries/pages/c558177b40b82223aa5247e48b550d9e8e0ee9b1#agg.make_set), [`agg.min()`](https://docs.panther.com/ko/pantherflow/example-queries/pages/c558177b40b82223aa5247e48b550d9e8e0ee9b1#agg.min), [`agg.max()`](https://docs.panther.com/ko/pantherflow/example-queries/pages/c558177b40b82223aa5247e48b550d9e8e0ee9b1#agg.max), [`time.ago()`](https://docs.panther.com/ko/pantherflow/example-queries/pages/fd7f081827d975ce84e4194b201dbd8b50df09a1#time.ago), [`time.parse_timestamp()`](https://docs.panther.com/ko/pantherflow/example-queries/pages/fd7f081827d975ce84e4194b201dbd8b50df09a1#time.parse_timestamp), 그리고 [`toscalar()`](/ko/pantherflow/functions/other.md#toscalar)
## 다른 테이블에서 검색하기 위해 한 테이블에서 IP 가져오기
위협 헌팅 중에는 한 테이블에서 값을 가져와 다른 테이블에서 그 값을 검색하는 방향으로 피벗해야 하는 경우가 흔합니다. 아래 쿼리는 VPC Flow 로그 테이블에서 IP 주소를 가져온 다음, Okta System 로그에서 이를 검색합니다.
```kusto
let IPs = panther_logs.public.aws_vpcflow
| where p_event_time > time.ago(5d)
| where flowDirection == 'ingress'
| summarize IP = agg.make_set( re.substr(srcAddr, '(\\d{1,3})\\.(\\d{1,3})\\.(\\d{1,3})\\.(\\d{1,3})') );
panther_logs.public.okta_systemlog
| where p_event_time > time.ago(1d)
| where arrays.overlap(toscalar(IPs), p_any_ip_addresses)
```
위 구문은 다음을 활용합니다:
* [`let` 구문](/ko/pantherflow/statements.md#let-statements) 기능
* 연산자: [`summarize`](/ko/pantherflow/operators/summarize.md) 및 [`where`](/ko/pantherflow/operators/where.md)
* 함수: [`arrays.overlap()`](https://docs.panther.com/ko/pantherflow/example-queries/pages/c58ae0e898fd6f293efee986d6d1707148384f17#arrays.overlap), [`agg.make_set()`](https://docs.panther.com/ko/pantherflow/example-queries/pages/c558177b40b82223aa5247e48b550d9e8e0ee9b1#agg.make_set), [`re.substr()`](https://docs.panther.com/ko/pantherflow/example-queries/pages/2839050edbff540a165c3db723f0dcb8fedc898f#re.substr), [`time.ago()`](https://docs.panther.com/ko/pantherflow/example-queries/pages/fd7f081827d975ce84e4194b201dbd8b50df09a1#time.ago), 그리고 [`toscalar()`](/ko/pantherflow/functions/other.md#toscalar)
## 정규 표현식을 사용한 CIDR 매칭
이 쿼리는 regex 표현식과 일치하는 IP 주소를 AWS 로그에서 검색합니다.
```kusto
union aws_alb , amazon_eks_audit, aws_cloudtrail, aws_s3serveraccess
| where p_event_time > time.ago(7d)
| extend ip = coalesce(clientIp, sourceIPs, sourceIPAddress, remoteip)
| summarize events=agg.count() by ip, p_log_type
| where re.matches(ip, "^34\\.222\\..+\\..+$")
| sort events desc
```
위 구문은 다음을 활용합니다:
* 연산자: [`union`](/ko/pantherflow/operators/union.md), [`where`](/ko/pantherflow/operators/where.md), [`extend`](/ko/pantherflow/operators/extend.md), [`summarize`](/ko/pantherflow/operators/summarize.md), 그리고 [`정렬`](/ko/pantherflow/operators/sort.md)
* 함수: [`coalesce()`](/ko/pantherflow/functions/other.md#coalesce), [`agg.count()`](https://docs.panther.com/ko/pantherflow/example-queries/pages/c558177b40b82223aa5247e48b550d9e8e0ee9b1#agg.count), 그리고 [`re.matches()`](https://docs.panther.com/ko/pantherflow/example-queries/pages/2839050edbff540a165c3db723f0dcb8fedc898f#re.matches)
결과:
| events | ip | p\_log\_type |
| ------ | ---------------- | ---------------- |
| `5866` | `34.222.253.62` | `AWS.CloudTrail` |
| `184` | `34.222.140.16` | `AWS.CloudTrail` |
| `176` | `34.222.42.181` | `AWS.CloudTrail` |
| `171` | `34.222.87.204` | `AWS.CloudTrail` |
| `88` | `34.222.241.235` | `AWS.CloudTrail` |
| ... | | |
## API 키 생성 알러트 조사하기
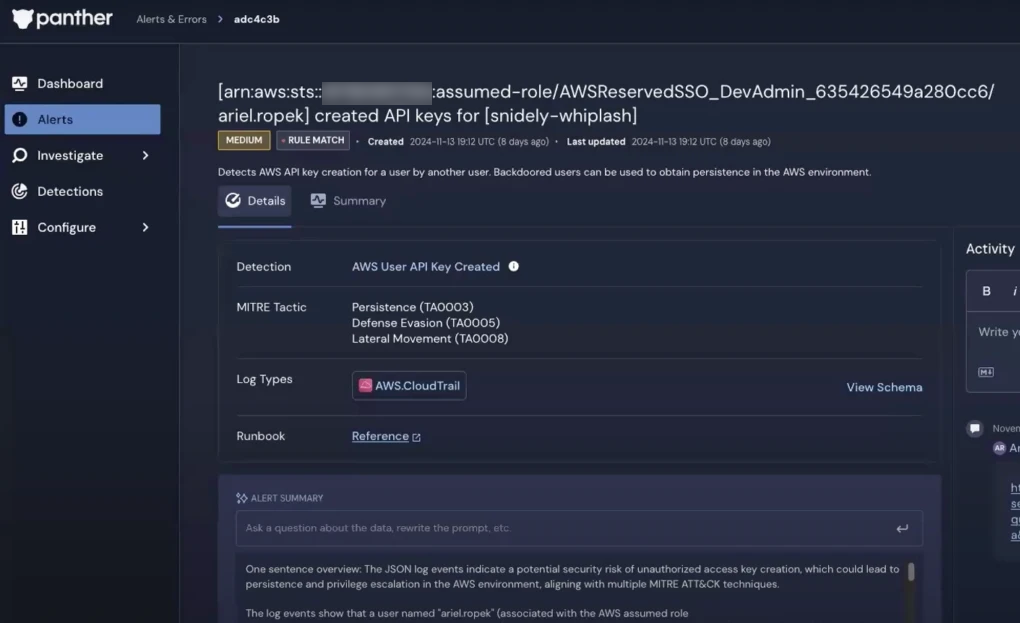
이 시나리오에서는 Panther 관리형 항목과 일치한다는 알러트를 받았습니다 [AWS 사용자 API 키 생성됨](https://github.com/panther-labs/panther-analysis/blob/main/rules/aws_cloudtrail_rules/aws_iam_user_key_created.yml) 디택션으로, CloudTrail 데이터에서 실행되며 다른 사용자가 AWS 사용자를 위해 AWS API 키를 생성할 때 알러트를 발생시킵니다.
{% hint style="info" %}
이 위협 시나리오는 또한 [Risky Business 팟캐스트의 동영상에서도 단계별로 다뤄집니다](https://risky.biz/video/product-demo-the-pantherflow-piped-query-language-for-the-panther-siem/), 그리고 Panther 블로그에서도: [PantherFlow로 Amazon EKS 권한 상승 조사하기](https://panther.com/blog/investigating-amazon-eks-privilege-escalation-with-pantherflow).
{% endhint %}
이 이벤트는 다음이라는 행위자가 `ariel.ropek` 다음이라는 새 사용자에 대한 API 키를 생성했음을 알려줍니다. `snidely-whiplash`. 이 동작이 오탐인지 실제 침해인지 알아보겠습니다.
1. 먼저 다음을 살펴보겠습니다: `ariel.ropek`의 알러트 전후 1시간 동안의 활동:
```kusto
panther_logs.public.aws_cloudtrail
| where p_event_time between time.parse_timestamp('2024-11-13 19:00') .. time.parse_timestamp('2024-11-13 20:00')
| extend p_actor = strings.split(userIdentity.arn, '/')[arrays.len(strings.split(userIdentity.arn, '/'))-1]
| where p_actor == 'ariel.ropek'
| sort p_event_time desc
```
\
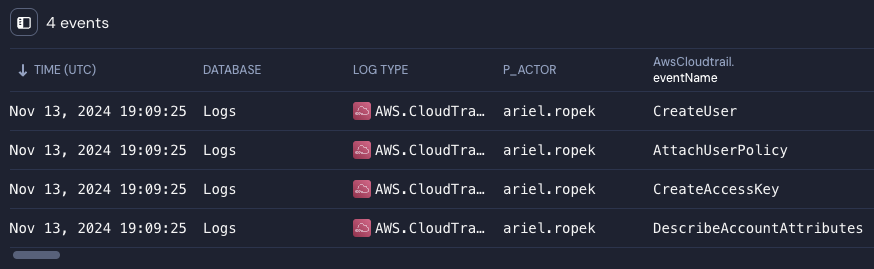
결과:
흥미롭습니다! 우리는 다음이 단순히 `ariel.ropek` 라는 이름의 새 사용자를 만들었을 뿐만 아니라 `snidely-whiplash`, 거기에 다음을 연결했음을 볼 수 있습니다. `AdministratorAccess` 정책도 적용했습니다:
2. 다음을 추가해 `snidely-whiplash` 쿼리에 넣어 그들의 활동을 확인해 보겠습니다:
```kusto
panther_logs.public.aws_cloudtrail
| where p_event_time between time.parse_timestamp('2024-11-13 19:00') .. time.parse_timestamp('2024-11-13 20:00')
| extend p_actor = strings.split(userIdentity.arn, '/')[arrays.len(strings.split(userIdentity.arn, '/'))-1]
| where p_actor in ['ariel.ropek', 'snidely-whiplash']
| sort p_event_time desc
```
\
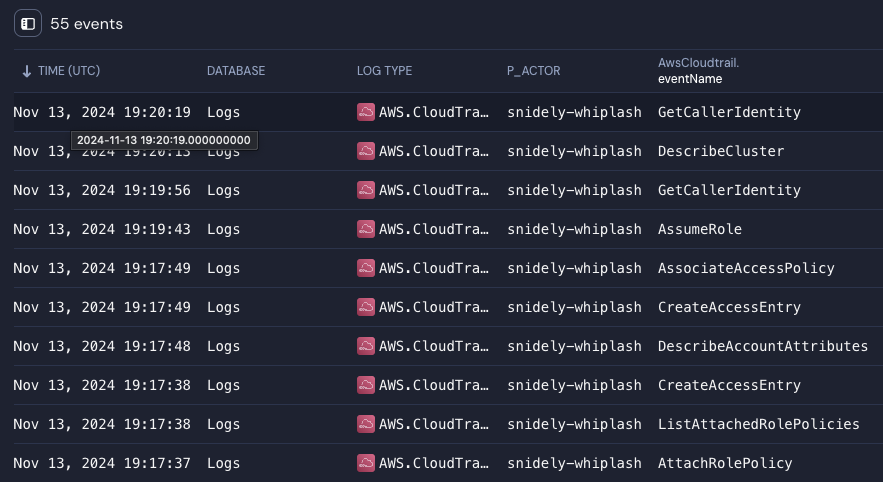
결과:
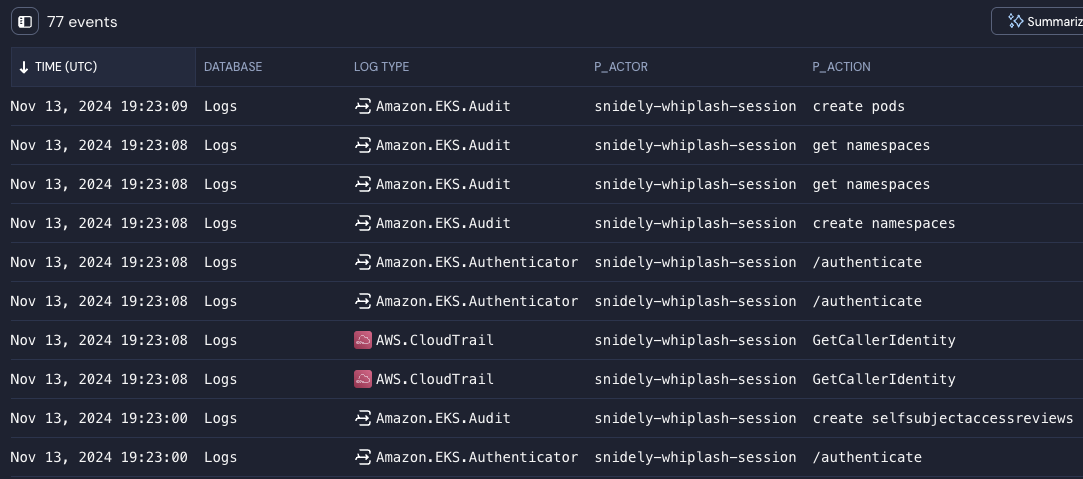
다음을 포함하면 훨씬 더 많은 결과가 나옵니다 `snidely-whiplash` 가 포함되면—이 사용자가 EKS에서 명령을 실행한 것을 볼 수 있습니다. 그들은 새 역할을 만들고 다음을 연결했습니다: `AmazonEKSClusterAdminPolicy` 그 역할에 적용한 다음, 새 세션 이름으로 그 역할을 가정했습니다, `snidely-whiplash-session`.
3. 이제 사용자가 EKS에서 작업을 수행한 것을 알았으므로 다음을 사용해야 합니다: [`union`](/ko/pantherflow/operators/union.md) 검색 범위를 EKS Audit 및 Authenticator 로그까지 확장해야 합니다.\
\
CloudTrail, EKS Audit, EKS Authenticator 로그는 각각 서로 다른 스키마를 가지지만, 우리는 다음을 사용해 [`coalesce()`](/ko/pantherflow/functions/other.md#coalesce) 이 로그 소스를 공통 항목에 매핑하는 데이터 모델을 만들 수 있습니다: `행위자` 및 `동작` 필드:
```kusto
union panther_logs.public.aws_cloudtrail, panther_logs.public.amazon_eks_audit, panther_logs.public.amazon_eks_authenticator
| where p_event_time between time.parse_timestamp('2024-11-13 19:00') .. time.parse_timestamp('2024-11-13 20:00')
| extend p_aws_arn = coalesce(userIdentity.arn, user.username, arn)
| extend p_actor = strings.split(p_aws_arn, '/')[arrays.len(strings.split(p_aws_arn, '/'))-1]
| extend p_action = coalesce(eventName, strings.cat(verb, ' ', objectRef.resource), path)
| where p_actor in ['ariel.ropek', 'snidely-whiplash', 'snidely-whiplash-session']
| sort p_event_time desc
```
\
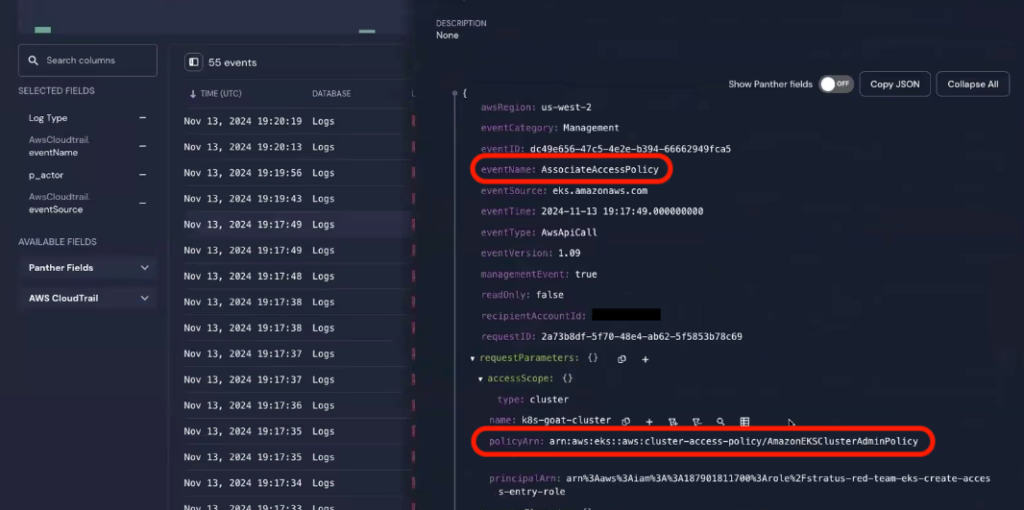
결과:
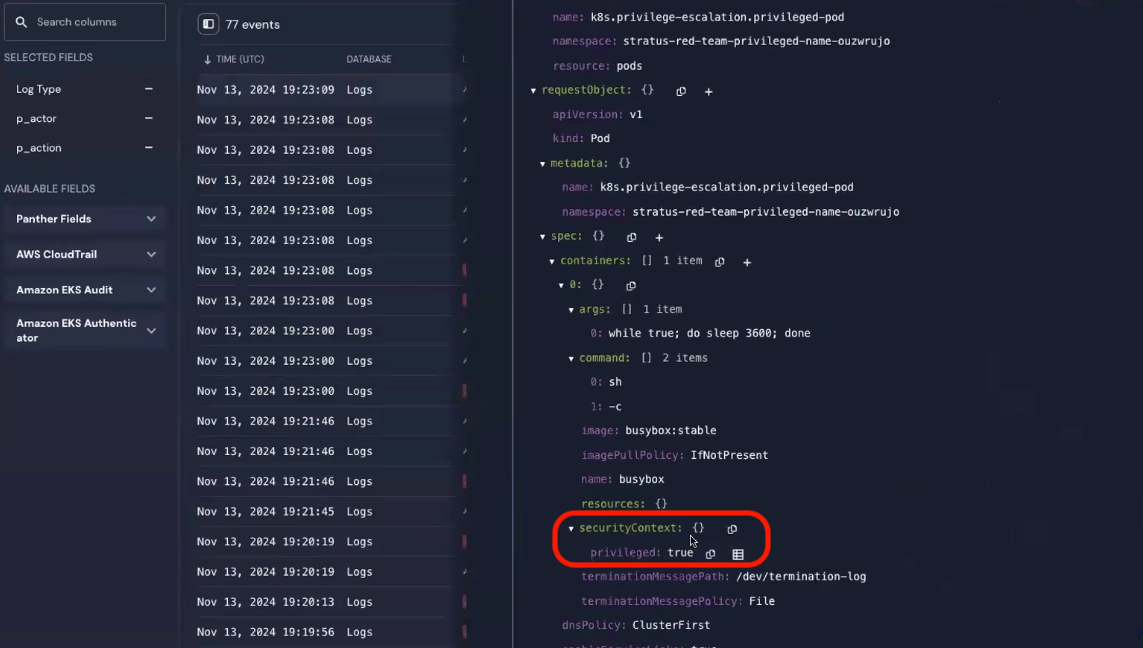
다음을 살펴보면 `p_action` 열에서, 다음을 사용하여 `snidely-whiplash-session`, 사용자가 Kubernetes 포드를 생성했음을 알 수 있습니다 (`create pods`). 전체 이벤트를 열어보면, 그들이 만든 포드가 권한이 상승된 상태임을 알 수 있습니다:
\
이 시점에서, 이는 매우 높은 확률로 악의적인 행위자라고 결론 내릴 수 있습니다. 요약하면, 우리는 다음을 발견했습니다:
1. AWS 사용자 (`ariel.ropek`)가 새 사용자 (`snidley-whiplash`)를 관리자 권한으로 생성했습니다.
2. `snidley-whiplash` EKS로 피벗하여 그곳에서 권한을 상승시켜 클러스터 관리자가 되었습니다.
3. 그들은 EKS에서 권한이 있는 포드를 생성했습니다.
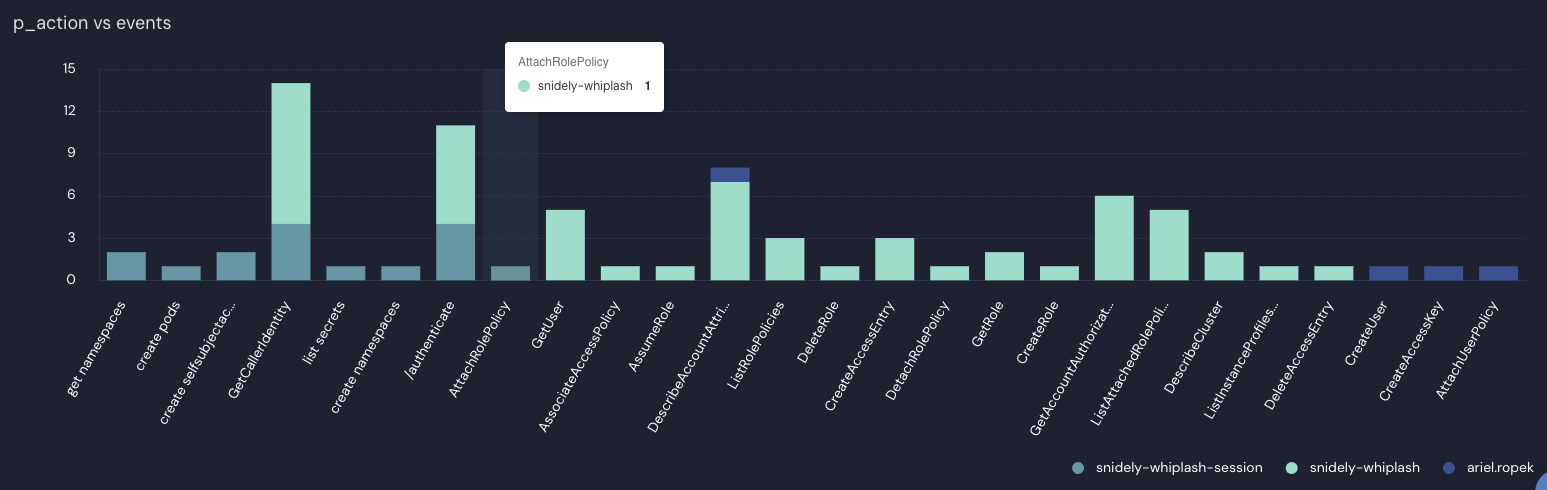
4. 우리는 다음이 포함된 차트에서 전체 공격 체인을 볼 수 있습니다 [`시각화`](/ko/pantherflow/operators/visualize.md):
```kusto
union panther_logs.public.aws_cloudtrail, panther_logs.public.amazon_eks_audit, panther_logs.public.amazon_eks_authenticator
| where p_event_time between time.parse_timestamp('2024-11-13 19:00') .. time.parse_timestamp('2024-11-13 20:00')
| extend p_aws_arn = coalesce(userIdentity.arn, user.username, arn)
| extend p_actor = strings.split(p_aws_arn, '/')[arrays.len(strings.split(p_aws_arn, '/'))-1]
| extend p_action = coalesce(eventName, strings.cat(verb, ' ', objectRef.resource), path)
| where p_actor in ['ariel.ropek', 'snidely-whiplash', 'snidely-whiplash-session']
| summarize events = agg.count() by p_actor, p_action
| visualize bar xcolumn = p_action
| sort p_actor
```
\
결과:
위의 시각화에서 공격 체인은 오른쪽에서 왼쪽으로 추적할 수 있으며, 다음으로 시작합니다 `ariel.ropek`'s 행동.
---
# Agent Instructions
This documentation is published with GitBook. GitBook is the documentation platform designed so that both humans and AI agents can read, navigate, and reason over technical content effectively. Learn more at gitbook.com.
## Querying This Documentation
If you need additional information that is not directly available in this page, you can query the documentation dynamically by asking a question.
Perform an HTTP GET request on the current page URL with the `ask` query parameter, and the optional `goal` query parameter:
```
GET https://docs.panther.com/ko/pantherflow/example-queries/threat-hunting.md?ask=&goal=
```
`ask` is the immediate question: it should be specific, self-contained, and written in natural language.
`goal` is optional and describes the broader end goal you are ultimately trying to accomplish on behalf of the user. GitBook uses it to tailor the answer towards what is most useful for that goal.
The response will contain a direct answer to the question and relevant excerpts and sources from the documentation.
Use this mechanism when the answer is not explicitly present in the current page, you need clarification or additional context, or you want to retrieve related documentation sections.