Custom Webhook Destination

Configuring a Custom Webhook as an alert destination in your Panther Console

Overview

Destinations are integrations that receive alerts from rules, policies, system health notifications, and rule errors. Panther supports configuring a Custom Webhook as the destination where you will receive alerts.

A Custom Webhook Destination requires only a URL to the service which can accept an HTTP POST request containing a JSON payload. This destination type is designed to allow Panther to communicate with other third-party integrations.

How to set up a Custom Webhook alert destination in Panther

Delivery and Ack

The webhook must accept and acknowledge Panther's POST request with an HTTP status code in the 2XX range. If there were any network failures or non 2XX codes, Panther will attempt to retry the request up to ten (10) times before permanent failure.

The webhook response body will be stored in the delivery status which can be viewed in the Alert Details page.

In the event of a permanent delivery failure, Panther logs and provides workflow continuity by allowing the alert to be manually re-sent by visiting the Alert Details page and viewing the Delivery Status section.

Set up a custom webhook in Panther

  1. Log in to the Panther Console.

  2. On the left sidebar click Configure > Alert Destinations.

  3. Click +Add your first Destination.

    • If you have already created Destinations, click Create New in the upper right side of the page to add a new Destination.

  4. Click Custom Webhook.

  5. Fill out the form:

    • Display Name: Add a friendly name to identify your destination.

    • Custom Webhook URL: Enter your Custom Webhook forwarding URL.

      • If you follow the ngrok example later in this documentation, you would enter the http or https Forwarding URL from the ngrok output.

    • Severity: Select the severity level of alerts to send to this Destination.

    • Alert Types: Select the alert types to send to this Destination.

  6. Click Add Destination.

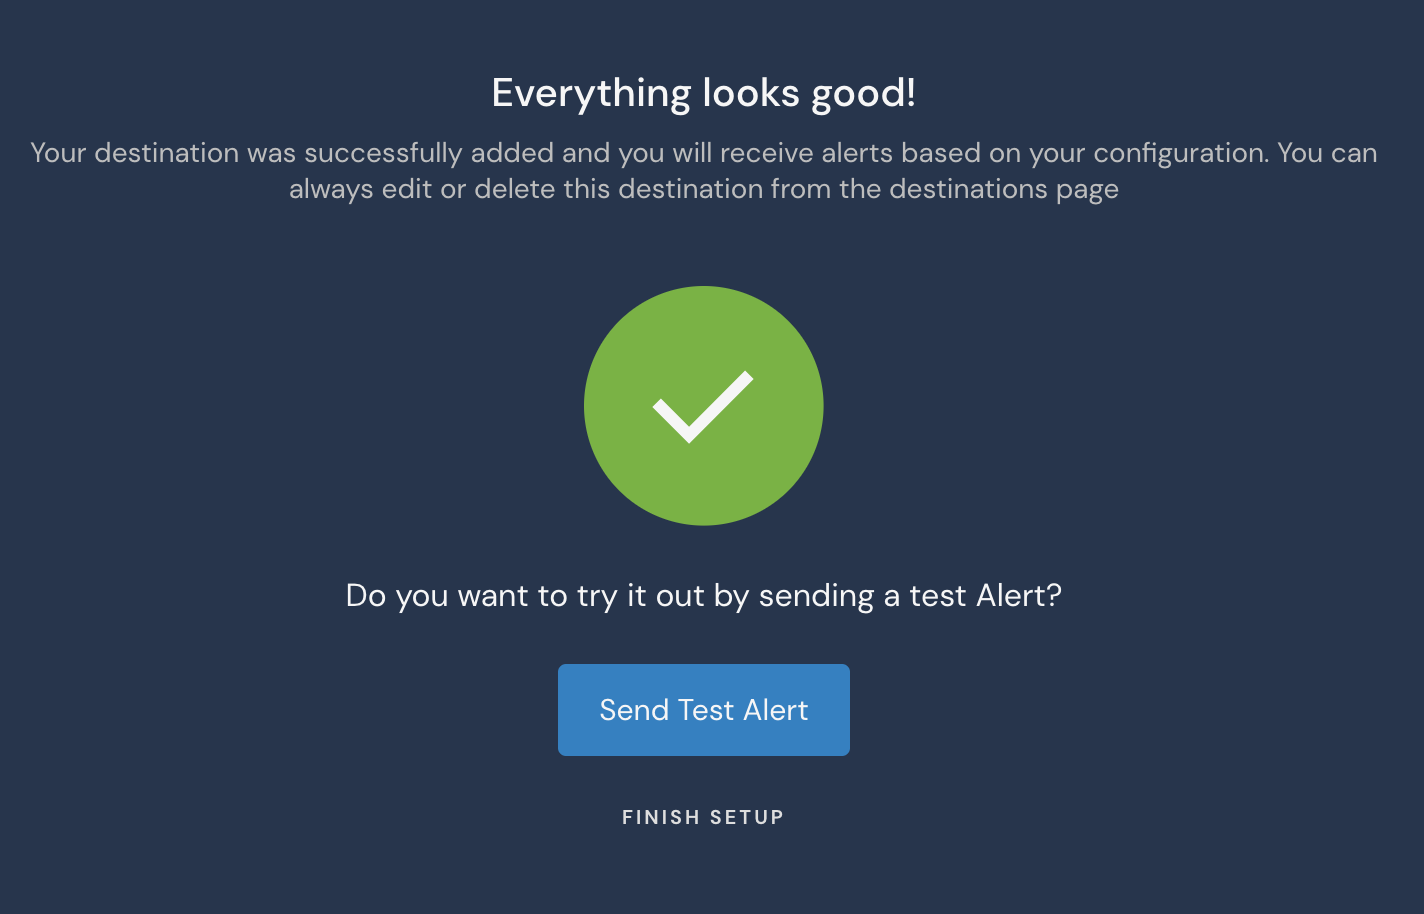
  7. On the final page, optionally click Send Test Alert to test the integration using a test payload. When you are finished, click Finish Setup.

Custom Webhook Alert Schema

A Custom Webhook will deliver a payload containing the following fields:

FieldTypeDescription

id

string

Identifier of the alert's detection

createdAt

string

Alert creation time as AWSDateTime (ISO-8601)

severity

string

Severity of the alert

type

string

Type of the alert

link

string

Link to the alert in the Panther Console

title

string

Title of the alert

name

string

Name of the alert's detection

alertId

string

Identifier of the alert in Panther Backend

description

string

Description associated with the alert

runbook

string

Runbook associated with the alert

tags

string[]

List of tags associated with the alert

version

string

Version identifier for the alert's detection

alertContext

object

Alert Context data attached to the alert

The AWSDateTime scalar type represents a valid extended ISO 8601 DateTime string. In other words, this scalar type accepts datetime strings of the form YYYY-MM-DDThh:mm:ss.sssZ. The field after the seconds field is a nanoseconds field. It can accept between 1 and 9 digits. The seconds and nanoseconds fields are optional (the seconds field must be specified if the nanoseconds field is to be used). The time zone offset is compulsory for this scalar. The time zone offset must either be Z (representing the UTC time zone) or be in the format ±hh:mm:ss. The seconds field in the timezone offset will be considered valid even though it is not part of the ISO 8601 standard.

Example JSON payload:

{
  "id": "AllLogs.IPMonitoring",
  "createdAt": "2020-10-13T03:35:24Z",
  "severity": "INFO",
  "type": "RULE",
  "link": "https://runpanther.io/alerts/b90c19e66e160e194a5b3b94ec27fb7c",
  "title": "New Alert: Suspicious traffic detected from [123.123.123.123]",
  "name": "Monitor Suspicious IPs",
  "alertId": "b90c19e66e160e194a5b3b94ec27fb7c",
  "description": "This rule alerts on any activity outside of our IP address whitelist",
  "runbook": "",
  "tags": [
    "Network Monitoring",
    "Threat Intel"
  ],
  "version": "CJm9PiaXV0q8U0JhoFmE6L21ou7e5Ek0"
}

Custom Webhook example

The following example demonstrates sending Panther alerts to a custom webhook which forwards the payload to a simple Node.js server proxied via Ngrok.

  1. Open Command Line.

  2. Create an ngrok account and install ngrok

    1. Run this config command: ngrok config add-authtoken <token>

    2. Run this command to start the service on port 8081: ngrok http 8081

  3. Create a file, webhook.js, and paste the following snippet:

    const http = require('http')
    const util = require('util')
    const port = 8081
    
    const requestHandler = (req, res) => {
    
      if (req.method === 'POST') {
        let body = '';
        req.on('data', chunk => {
          body += chunk.toString();
        });
        req.on('end', () => {
          console.log(util.inspect(JSON.parse(body), false, null, true));
          res.statusCode = 200; // Must ack the request
          res.end("success"); // (Optional) response body
        });
      }
    }
    
    const server = http.createServer(requestHandler)
    
    server.listen(port, (err) => {
      if (err) {
        return console.log('something bad happened', err)
      }
    
      console.log(`server is listening on ${port}`)
    })
  4. Open another terminal and start the Node.js server:

    > node webhook.js
    server is listening on 8081
  5. In the Panther Console, create a new Custom Webhook and paste the Forwarding URL from ngrok into the Custom Webhook URL field.

    • For example, the forwarding URL might look like: https://2d9c-174-27-211-147.ngrok-free.app

  6. Click Send a test alert to see that the node.js server logs the test event.

Additional Information on Destinations

For more information on alert routing order, modifying or deleting destinations, and workflow automation, please see the Panther docs: Destinations.

Last updated