Search
Construct a data query without writing SQL
Last updated
Construct a data query without writing SQL
Last updated
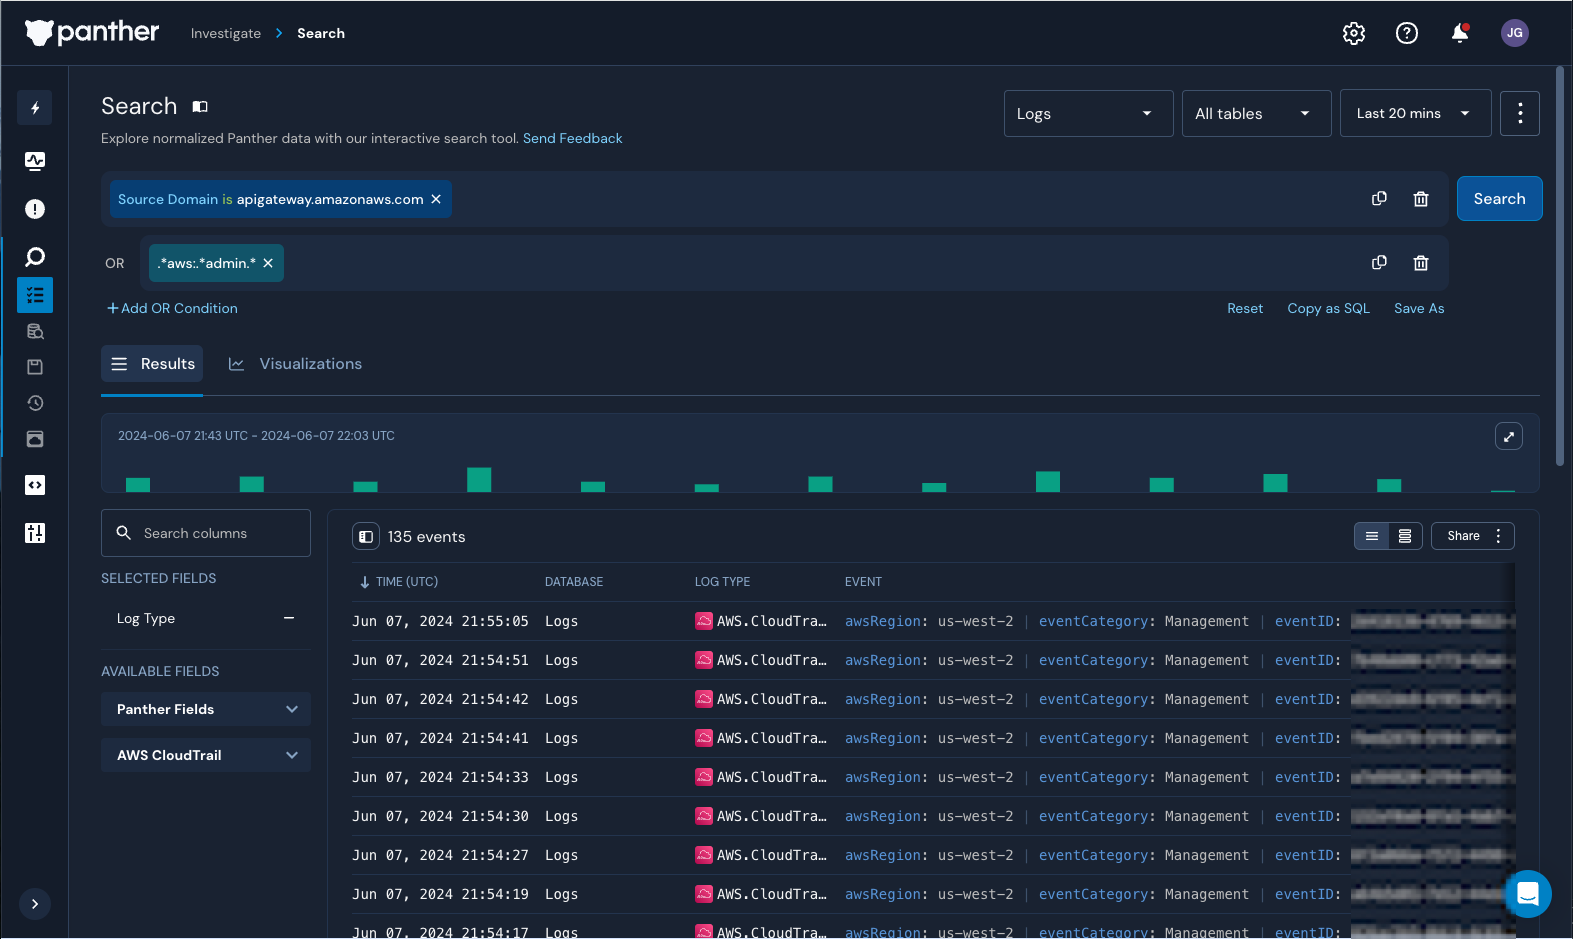
In the Search tool in Panther, search across all of your data—including log events, rule matches, and more—without writing SQL. You can use dropdown fields to create filter expressions, and group them using AND
and OR
functionality. It's also possible to execute PantherFlow queries in Search.
Filter expressions can be constructed in different ways: as key/value pairs, a free text search, or a regular expression search. Each of these can also use wildcard characters. You can combine different types of filter expressions in one search.
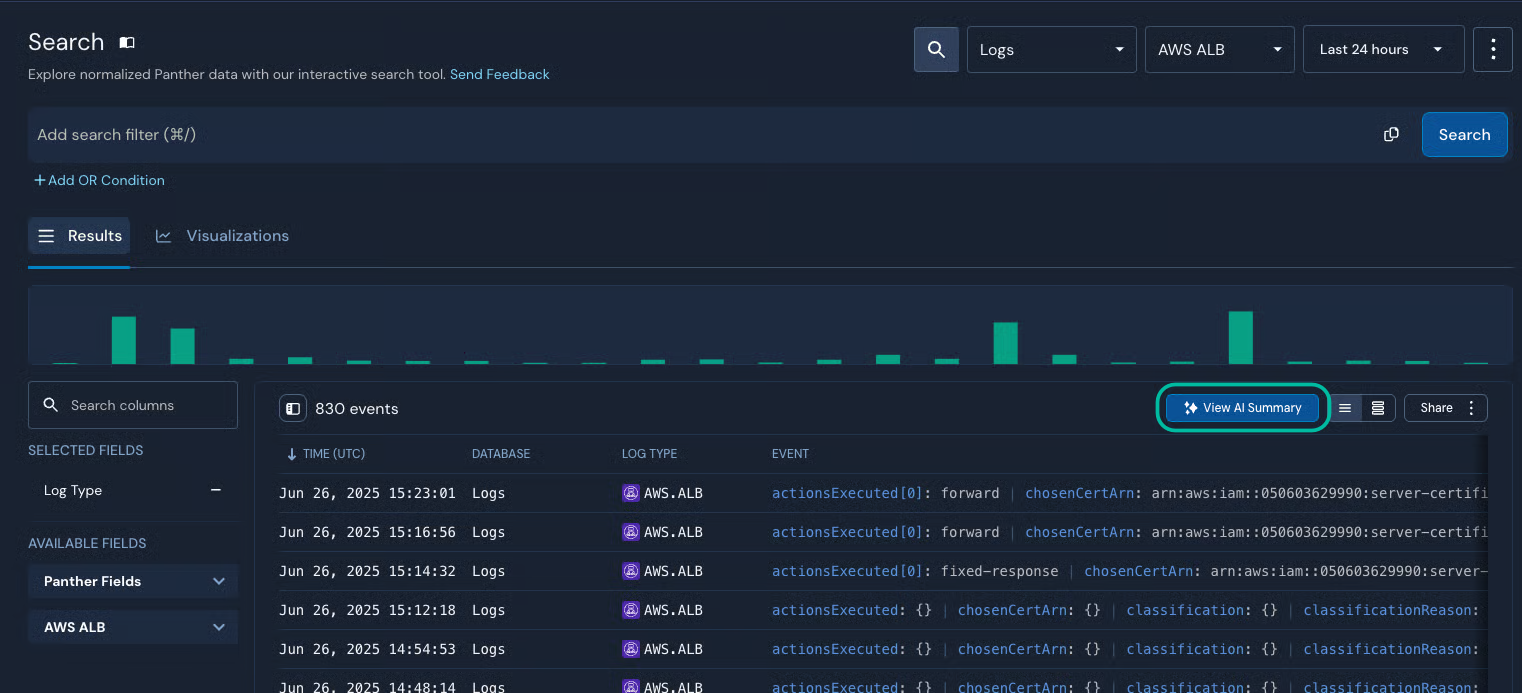
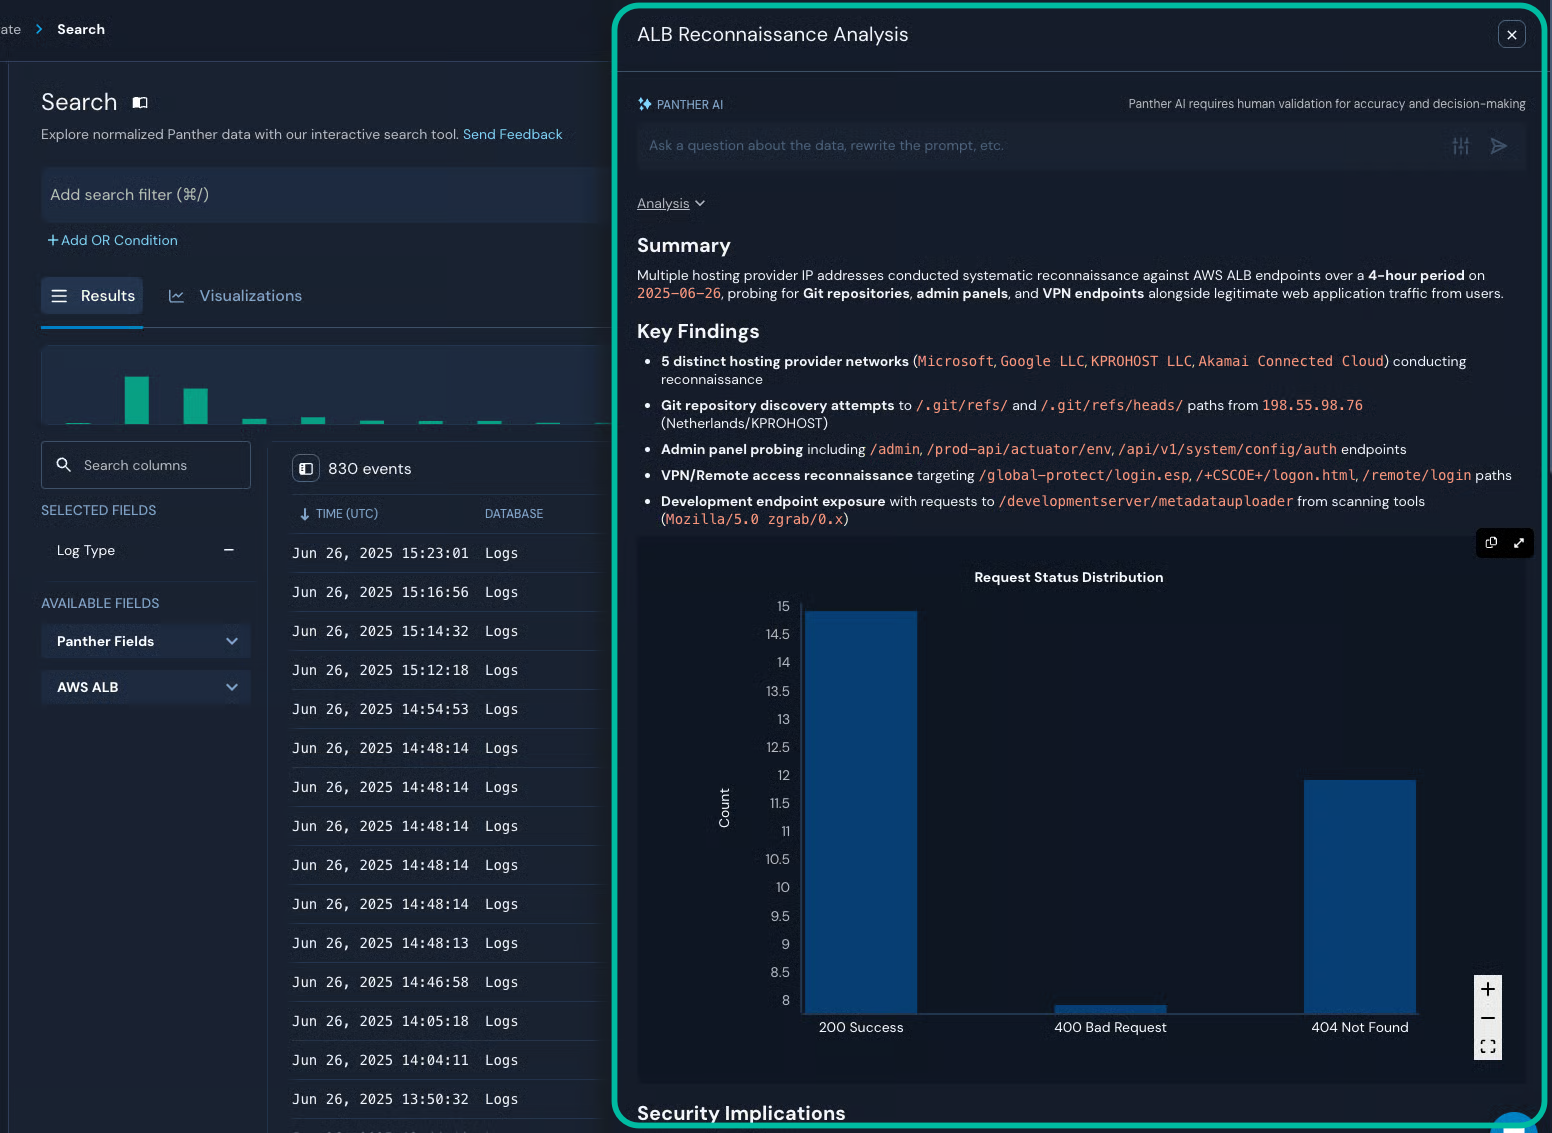
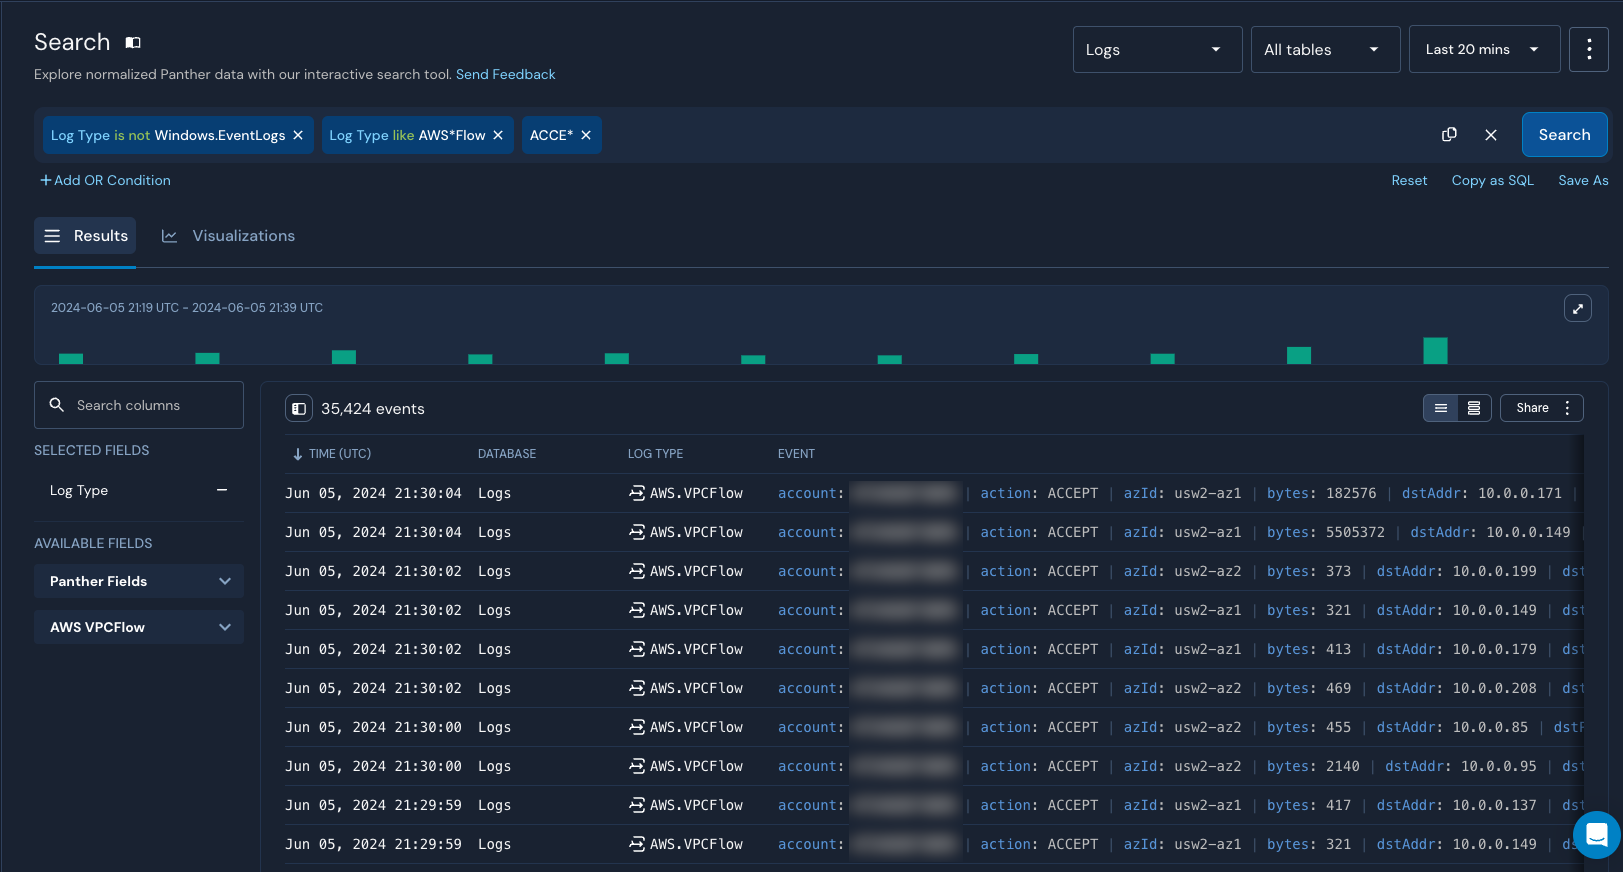
When a search is run, a results table is displayed below a histogram visualizing the distribution of result events over time. The results table is customizable—you can add or remove event fields as columns. Also from the results table, you can add inclusive/exclusive filters to your search, pivot, and look up related enrichment data. You can collaborate with your team by downloading the results table, or sharing a link to your specific search in Panther.
You can effectively search your data using:
A combination of filters: Start by making selections in the database, table, and date range filters—then create your own filter expressions.
PantherFlow: Learn how to use PantherFlow in Search below
Use the database, table, and date range filters to narrow the scope of your search. Using these controls is optional, but can significantly improve search performance when searching over large data sets. Learn more about each of these filters below.
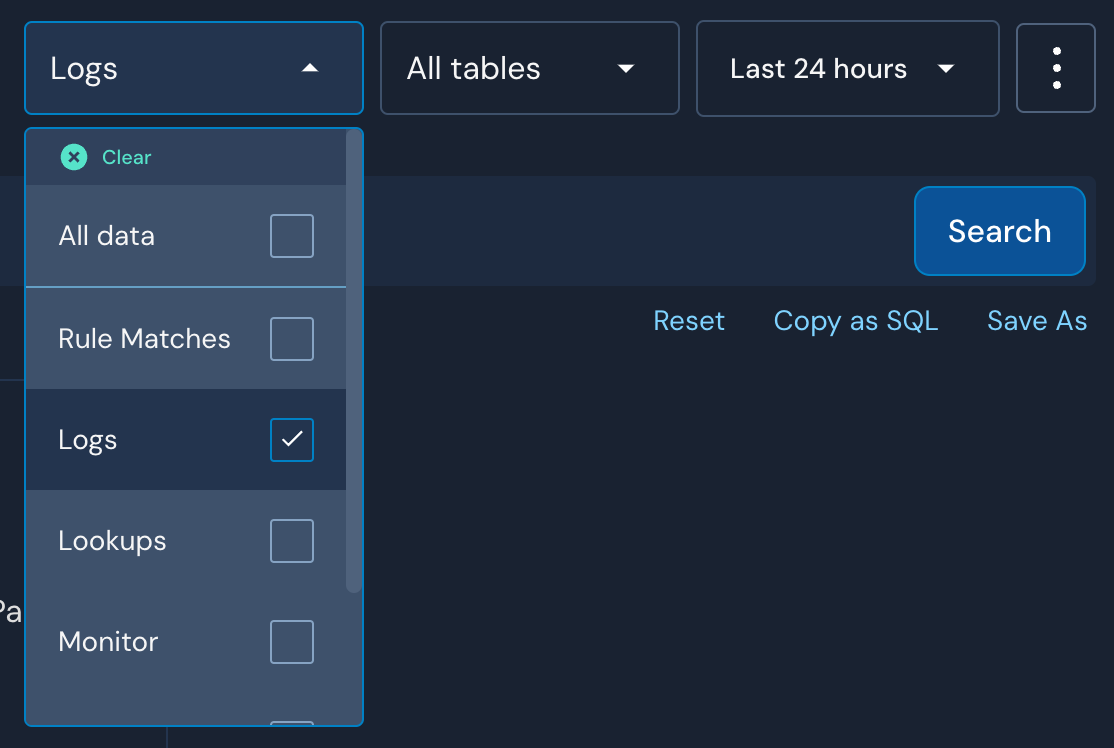
Use the database filter to narrow your search to certain databases, such as only Logs or Rule Matches.
The default value of this filter is Logs. The options contained in the database filter are:
Rule Matches
Logs
Lookups
Monitor
Cloud Security
Rule Errors
Signals
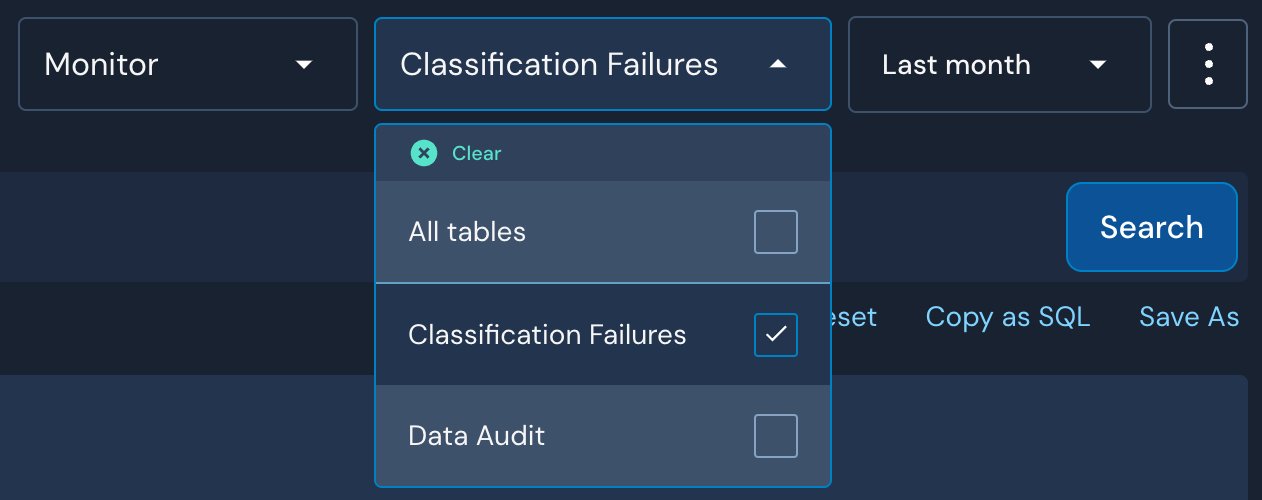
Use the table filter to narrow your search to certain tables, within the databases indicated by the database filter.
The default value of this filter is All tables, which includes all tables for each included database. You can narrow the search by selecting only certain tables in this dropdown.
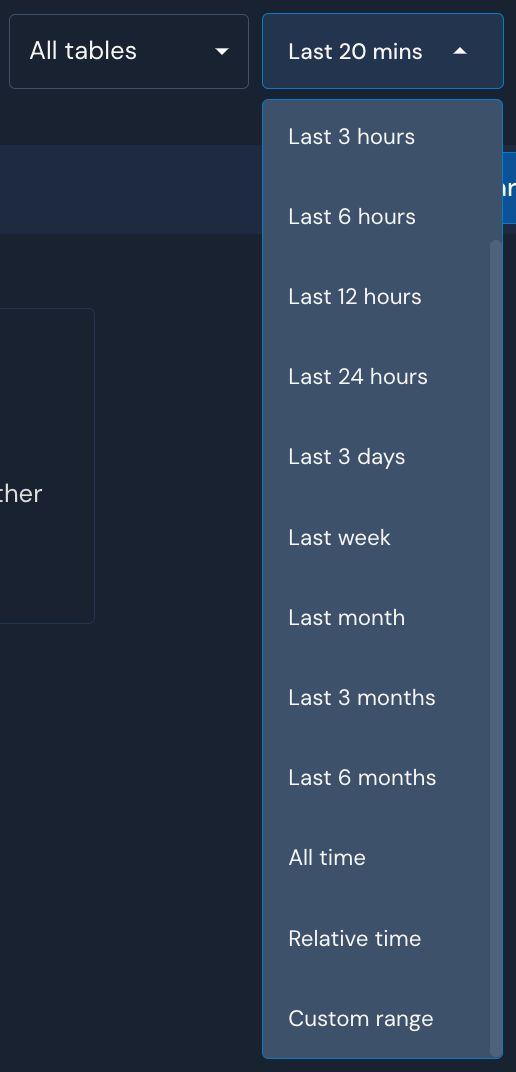
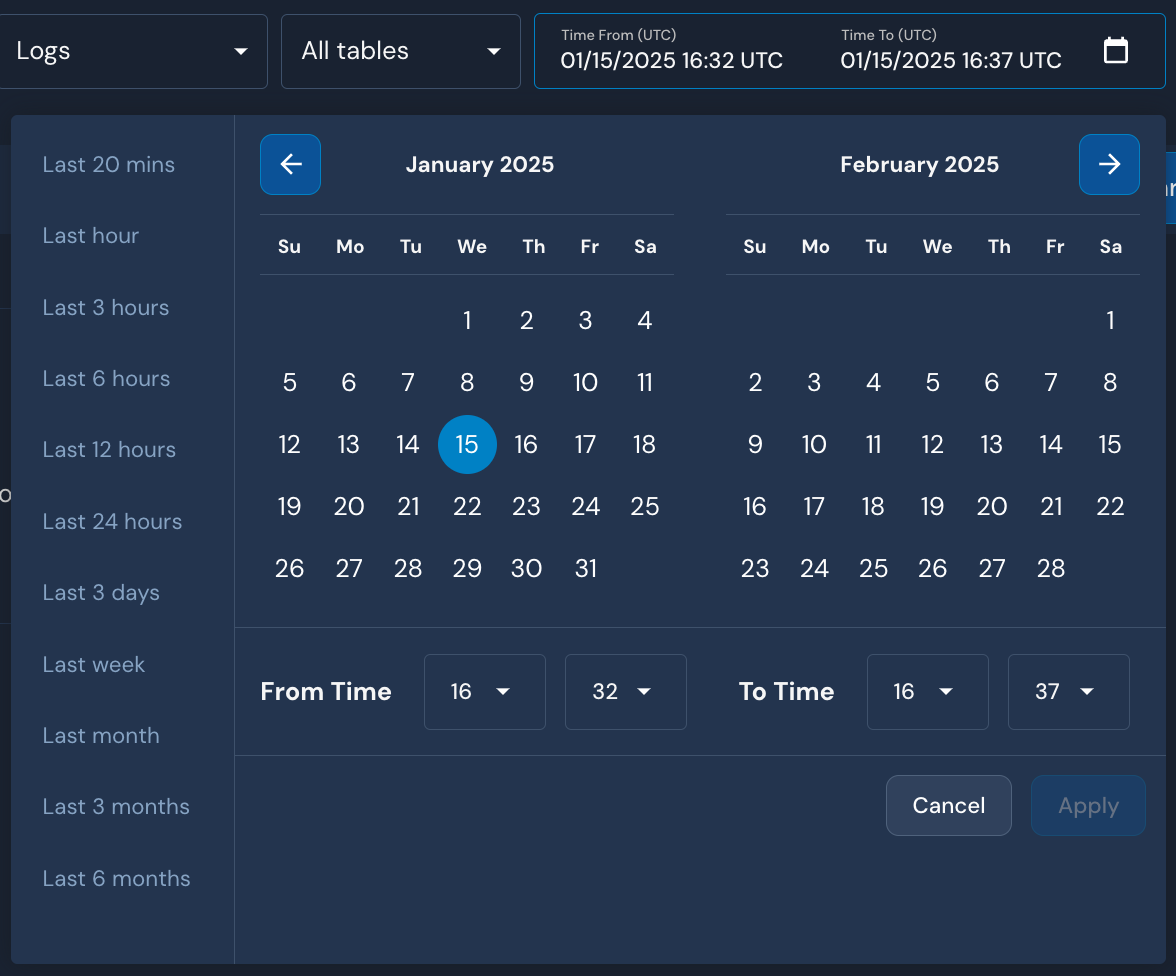
Use the date range filter to narrow your search to a certain period of time.
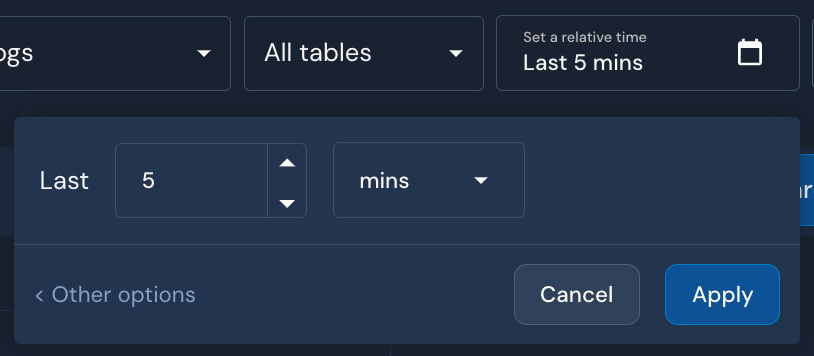
The default value of this filter is Last 20 mins. You can use one of the preset relative options (like Last hour or Last week), set your own relative window with Relative time, remove the time constraint with All time, or set a specific window with Custom range.
A filter expression is a clause containing your key/value search logic, free search terms, or match patterns. To create filter expressions, click the Add search filter bar or use the command
+ /
keyboard shortcut.
With a key/value filter expression, you will select an event key and provide a value (if necessary).
To create a key/value filter expression:
Click the Add search filter bar, or press command
+/
.
Select an event key from the dropdown list. The dropdown menu contains options grouped into the following categories:
All remaining tables with a matching field(s) are displayed in alphabetical order.
Select an operator (also known as a condition) from the dropdown menu.
The dropdown options will be limited to those applicable to the selected field's data type.
See a full list of available operators on Search Filter Operators.
Enter a value, if the selected operator requires one.
Learn more about using the wildcard character below.
If you would like to create another filter expression:
To create an AND
filter, click outside the expression you just created (but within the same horizontal bar), or press TAB
.
To create an OR
filter, click + Add OR Condition.
When you are ready to execute your search, click Search or press ENTER
.
If there are more than two rows, they will collapse. To expand all filters into view, click Show +n conditions.
You can also quickly create key/value filter expressions from the results set of an initial search.
In a free text filter expression, you will enter a string.
Free text filter expressions search every field in every event (within the database, table, and date constraints), including fields nested in complex objects.
To increase search performance, select a subset of tables to search.
To create a free text filter expression:
Click the Add search filter bar, or press command
+/
.
Enter the text value.
Learn more about using the wildcard character below.
If you would like to create another filter expression:
To create an AND
filter, click outside the expression you just created (but within the same horizontal bar), or press TAB
.
To create an OR
filter, click + Add OR Condition.
When you are ready to execute your search, click Search or press ENTER
.
If there are more than two rows, they will collapse. To expand all filters into view, click Show +n conditions.
Using regex in Search can be powerful for dynamic text-based searches across logs. Search supports POSIX-extended regular expressions.
To create a regex filter expression:
Click the Add search filter bar, or press command
+/
.
Press command
+/
to enter into regex mode.
To exit regex mode, you can press command
+/
again.
Enter the regular expression you wish to search, e.g., .*aws:.*admin.*
.
Learn more about using the wildcard character below.
If you would like to create another filter expression:
To create an AND
filter, click outside the expression you just created (but within the same horizontal bar), or press TAB
.
To create an OR
filter, click + Add OR Condition.
When you are ready to execute your search, click Search or press ENTER
.
If there are more than two rows, they will collapse. To expand all filters into view, click Show +n conditions.
The wildcard character (*
) may be used as a placeholder at the beginning, middle, or end of a string or expression. The wildcard character may be used within a key/value filter expression (only where the key has type: string
and the operator is LIKE
), free text filter expression, or regex filter expression.
The position of the wildcard character determines which data is returned as a match:
Beginning: Any character(s) at or preceding the *
are considered a match.
Middle: Any character(s) at the *
are considered a match.
End: Any character(s) at or following the *
are considered a match.
This functionality is not available when searching with PantherFlow.
When responding to a public breach disclosure or threat hunting generally, you may need to quickly find out whether any values in a list of Indicators of Compromise (IoCs) are found across any of your organization's event logs.
To search IoCs in Search:
Make database, table, and date range filter selections.
Click the Add search filter bar, or press command
+/
.
Type or paste in the indicator or list of indicators.
From the dropdown options that appear, select the (auto-detect) option.
Search parses the inputted string where there are spaces, commas, and semicolons—then detects whether each value matches a Panther Indictor Field. For each detected indicator field, Search creates a key/value filter expression. Other values remain as free text expressions.
Each filter expression is joined by an OR
.
Click Search or press ENTER
.
PantherFlow is in open beta starting with Panther version 1.110, and is available to all customers. Please share any bug reports and feature requests with your Panther support team.
To execute a PantherFlow query in Search:
In the left-hand navigation bar of your Panther Console, click Investigate > Search.
This will replace the filter expression builder with a PantherFlow code editor.
Enter your PantherFlow query.
If your PantherFlow query specifies a database/table, the database, table, and date range filters in the upper-right corner of the Search page are ignored.
If your PantherFlow query does not specify a database/table, the database, table, and date range filters are all applied. In this scenario, if your PantherFlow query includes a date/time range (with a | where p_event_time ...
statement), both date/time ranges are applied—i.e., returned data must fall within the date/time range set in both the date range filter and the range defined by the | where p_event_time ...
statement.
Learn how to construct a PantherFlow query in the PantherFlow documentation.
Note the current limitations of PantherFlow.
Click Search.
While it's possible to create a Saved Search in Search, it's not possible to schedule it (i.e., to create a Scheduled Search).
Creating a Saved Search means you can quickly reuse commonly run searches. Learn more on Saved and Scheduled Searches.
To create a Saved Search:
Create a search by following the instructions in How to use Search.
Under the Add search filter box, click Save As.
Enter values for the fields in the popup modal:
Search Name: Add a descriptive name.
Tags (optional): Add tags. Tags can be helpful to group related searches.
Description (optional): Describe the purpose of the search.
Click Save Search.
See the next section to learn how to open and reuse Saved Searches.
After creating a Saved Search in the Search tool, you can view and reuse it. It can be opened from the Search page, or from the Saved Searches page.
In the left-hand navigation bar of your Panther Console, click Investigate > Search.
In the upper right corner, click the three dots icon, then Open Saved Search.
An Open a Search modal will pop up, displaying previously saved search.
Find the search you'd like to open, select it, then click Open Search.
The Saved Search will populate in Search.
The results of a Search contain a histogram, a table of result events, and summary visualizations.
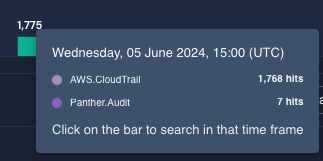
The results histogram displays the distribution of events within the search's date and time window, to help quickly contextualize results.
After a search is run, the histogram is shown collapsed by default. You can expand it by clicking the diagonal arrows button in the upper-right corner of the chart. Clicking the button again will collapse the chart.
To see additional data insights into the counts by log type for any of the time periods, hover over a bar within the chart.
To drill down and create a new search (in a new browser tab) with a time period set to that of one of the histogram bars, click the bar.
This drill down functionality is only available for bars in the table that represent timeframes longer than one minute.
You can customize a search's results table by adding, removing, and reordering columns.
You can also create a new filter directly from the results table, replace filter expressions with a results table value, and explore enrichment data for a results table value.
You can add a column to the Search results table using the Available Fields list on the left-hand side of the table, or from the JSON event view.
It is only possible to add nested fields to the table from the JSON event view.
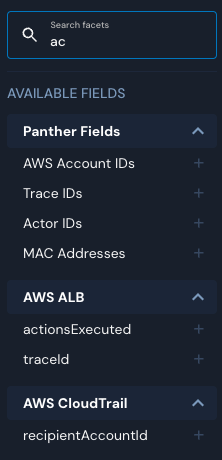
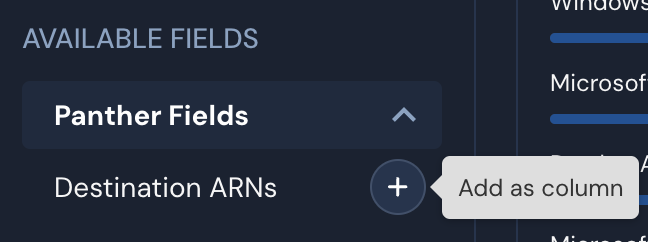
In the field list on the left-hand side of the results table, within the Available Fields header, locate the column you'd like to add to the results table.
Only top-level fields are shown in this list. If you'd like to add a nested field to the table, you can do so from the JSON event view.
To the right of the field, click + (the plus symbol).
The field will be added as a column in the results table, and listed on the left-hand side of the table within Selected Fields.
You can remove a column from the Search results table using the Selected Fields list on the left-hand side of the table, from the JSON event view, or from the table header row.
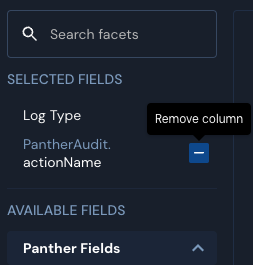
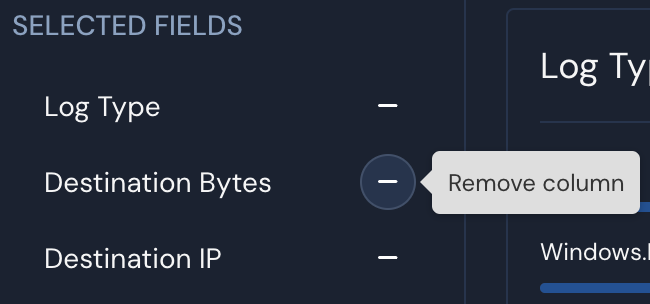
In the field list on the left-hand side of the results table, within the Selected Fields header, locate the field you'd like to remove from the results table.
To the right of the field, click - (the minus symbol).
The field's column will be removed from the results table, and listed on the left-hand side of the table within Available Fields.
Reorder the columns in the results table by clicking on a column header and dragging it to the desired position.
The results table is loaded, by default, in a compact view. This view displays all log fields, including the often sizable EVENT
field, in a single row. To view the EVENT
value in this view, scroll horizontally.
To more easily view the full event data, you can use detailed table view or the JSON event slide-out panel. An added benefit of using the slide-out panel is the ability to show or hide Panther fields.
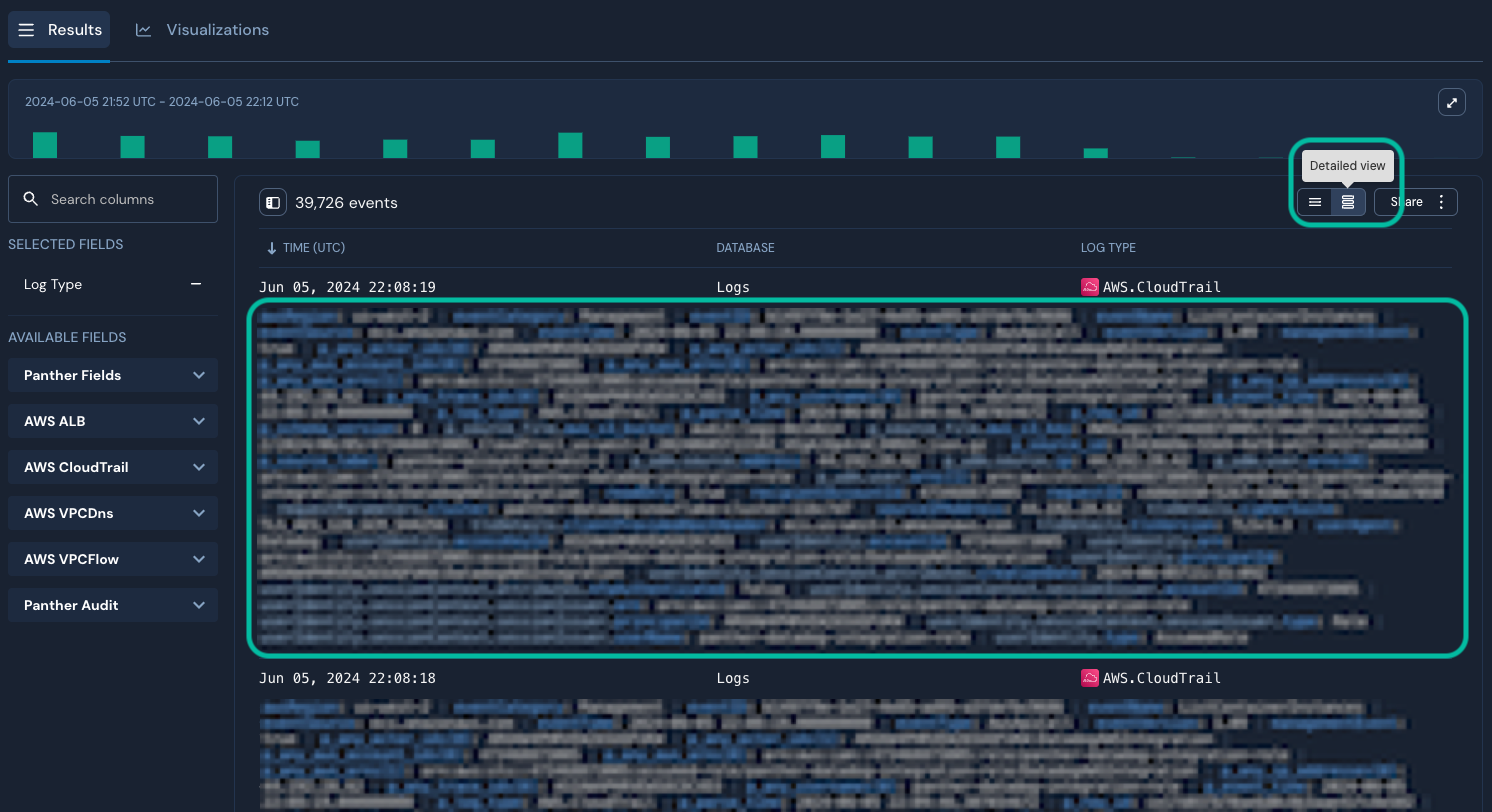
The results table can alternatively display logs in a detailed view. This view displays the EVENT
field value in a new row below the event's other fields, with text-wrapping.
To enable detailed view, click the toggle button in the upper-right corner of the table:
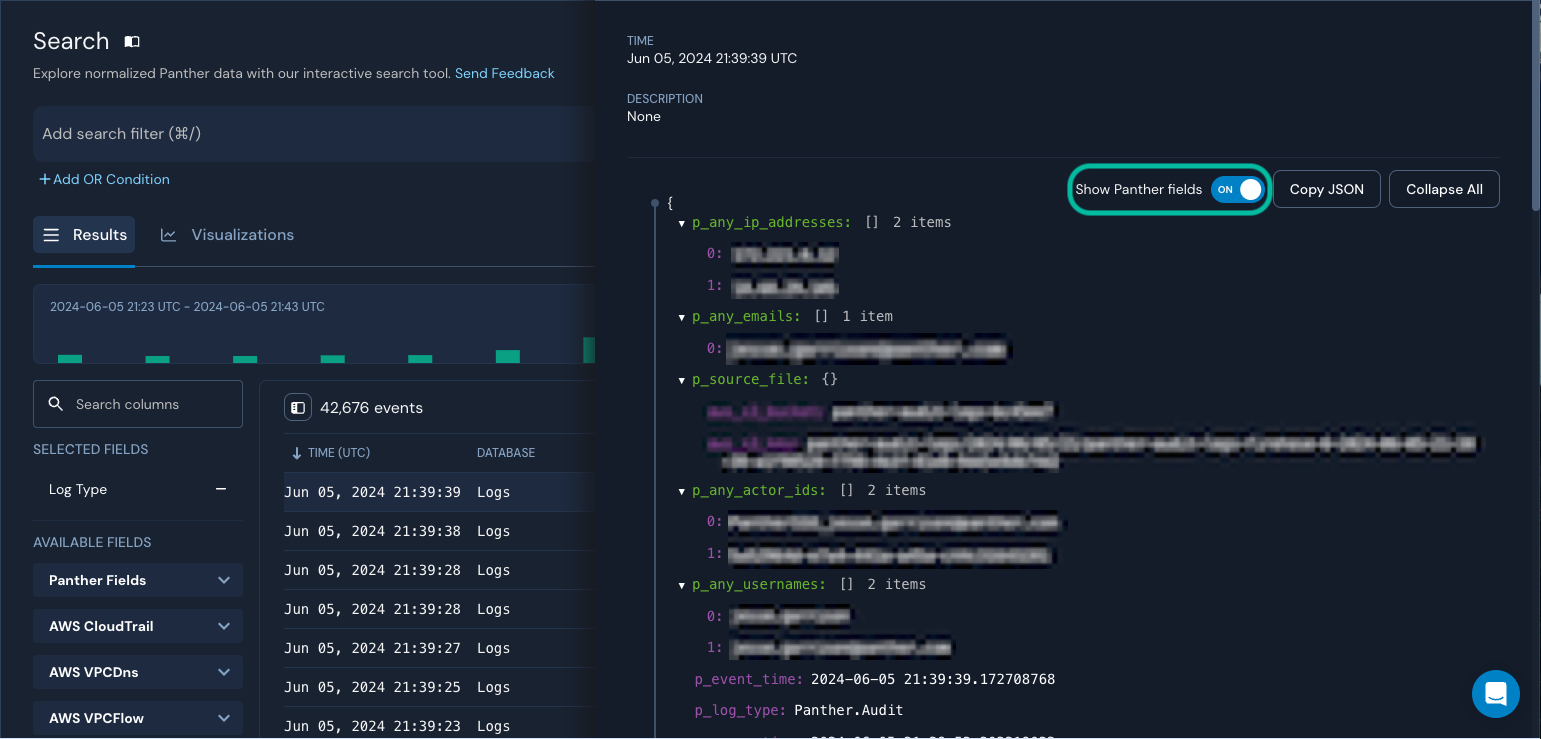
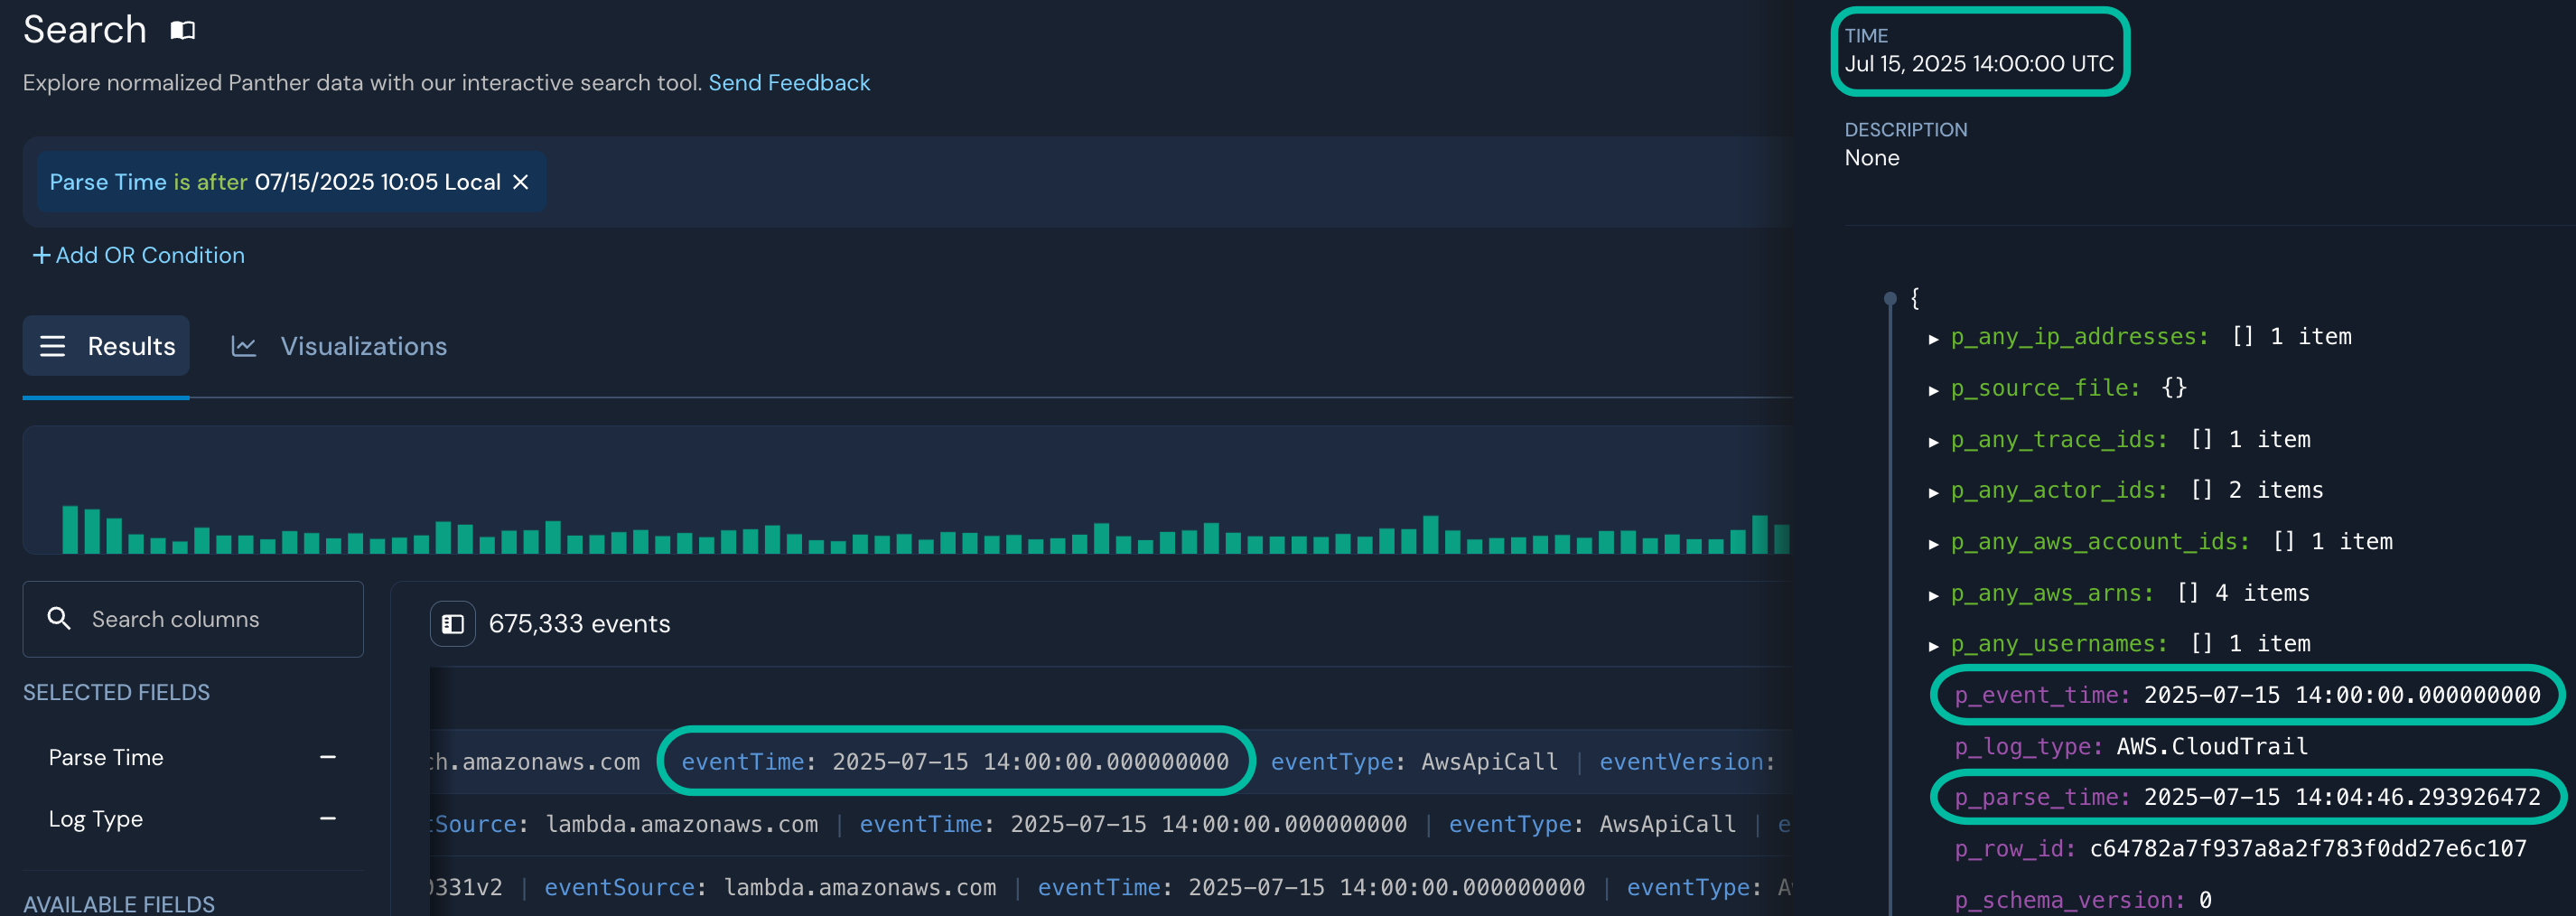
It's possible to view the full event data, in JSON format, by clicking an event row. This will open a slide-out panel on the right side of the browser window.
In the JSON event view, Panther fields are displayed at the top of the JSON object followed by the event fields. You can hide or reveal these fields by clicking the Show Panther fields toggle.
Hovering over fields in the slide-out panel will display icons with which you can perform additional actions, like adding a filter. Learn more in Iterating on a Search.
Within the results of a Search, the Visualizations tab displays bar charts for field values, which can help provide quick insights into your data. To view these charts, click Visualizations.
You can also create a filter directly from a summary chart, replace filters with a value from a summary chart, and explore enrichment data for a summary chart value.
How to add or remove summary charts
Add or remove visualizations for event fields using the Available Fields and Selected Fields lists on the left-hand side of the results panel. Adding or removing a field shows or hides the field both as a chart and as a column in the results table.
To add a visualization:
Within the Available Fields list, to the right of a field's name, click +.
To remove a visualization:
Within the Selected Fields list, to the right of a field's name, click –.
How to set the sort order of a chart
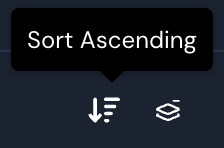
To sort results in ascending order (lowest to highest):
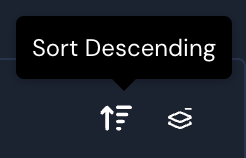
In the upper-right corner of a visualization, click the icon with an arrow pointing downward:
To sort results in descending order (highest to lowest):
In the upper-right corner of a visualization, click the icon with an arrow pointing upward:
How to expand or condense the number of values shown in a chart
To view the first 25 values in a visualization, in its lower-right corner, click Show Top 25. If there are fewer than 25 values available, the text will read Show all <number> rows instead. To view only the first five values in a visualization, in its lower-right corner, click Hide additional rows.
Directly from the JSON event slide-out panel and summary charts, you can create inclusive/exclusive filters, replace filter expressions with a results value, and explore enrichment data.
In the results table, locate the event row of interest, and click it.
The JSON event slide-out panel will be shown.
View the new filter expression in the search bar at the top of the window.
To refresh the search results, click Search.
In the results table, locate the event row of interest, and click it.
The JSON event slide-out panel will be shown.
In the JSON event slide-out panel, hover over the field on which you'd like to pivot.
All existing filters are replaced with a filter expression representing only the key/value you pivoted on.
To refresh the search results, click Search.
While investigating or threat hunting, it may be useful to share a Search or a results set with your team. To do this:
In the upper-right corner of the results table, click Share:
Select one of the menu options:
Copy link to view: Copies a URL to this specific Search to your clipboard.
Download CSV: Downloads a CSV of the results table.
Note that the downloaded CSV file contains only the first 1,000 results. To download the full results set, use Data Explorer. (You can click Copy as SQL in Search to quickly recreate it in Data Explorer.)
Panther Fields: Includes Indicator Fields (also known as p_any
fields), and Core Fields (p_udm
fields), which are useful when searching across log types.
Multiple tables: Fields that are found in more than one log type.
On the left side of the database filter, click </> to toggle to PantherFlow mode.
While hovering over the field, click + (the plus symbol).
While hovering over the field, click - (the minus symbol).
On the right side of the column header, click X.
In the JSON event slide-out panel, hover over the value you'd like to create an inclusive or exclusive filter expression for.
To create an inclusive filter, click .
To create an exclusive filter, click .
To create an inclusive filter, click .
To create an exclusive filter, click .
Click the replace icon .
Within a summary chart, hover over the value you would like to replace filter expression values with.
Click the replace icon .
In the JSON event slide-out panel, hover over the value you'd like to explore enrichment data for.
Click the enrichment icon .
In the Lookup Enrichment pop-up modal, use the LOOKUP TABLE
column to locate the row of the enrichment source you would like to explore, then click View JSON→
.
The enrichment entry will be shown.
Within a summary chart, hover over a value for which you would like to explore enrichment data.
Click the enrichment icon .
In the Lookup Enrichment pop-up modal, use the LOOKUP TABLE
column to locate the row of the enrichment source you would like to explore, then click View JSON→
.
The enrichment entry will be shown.