> For the complete documentation index, see [llms.txt](https://docs.panther.com/llms.txt). Markdown versions of documentation pages are available by appending `.md` to page URLs; this page is available as [Markdown](https://docs.panther.com/search/search-history.md).
# Search History
Monitor search status and stop running searches
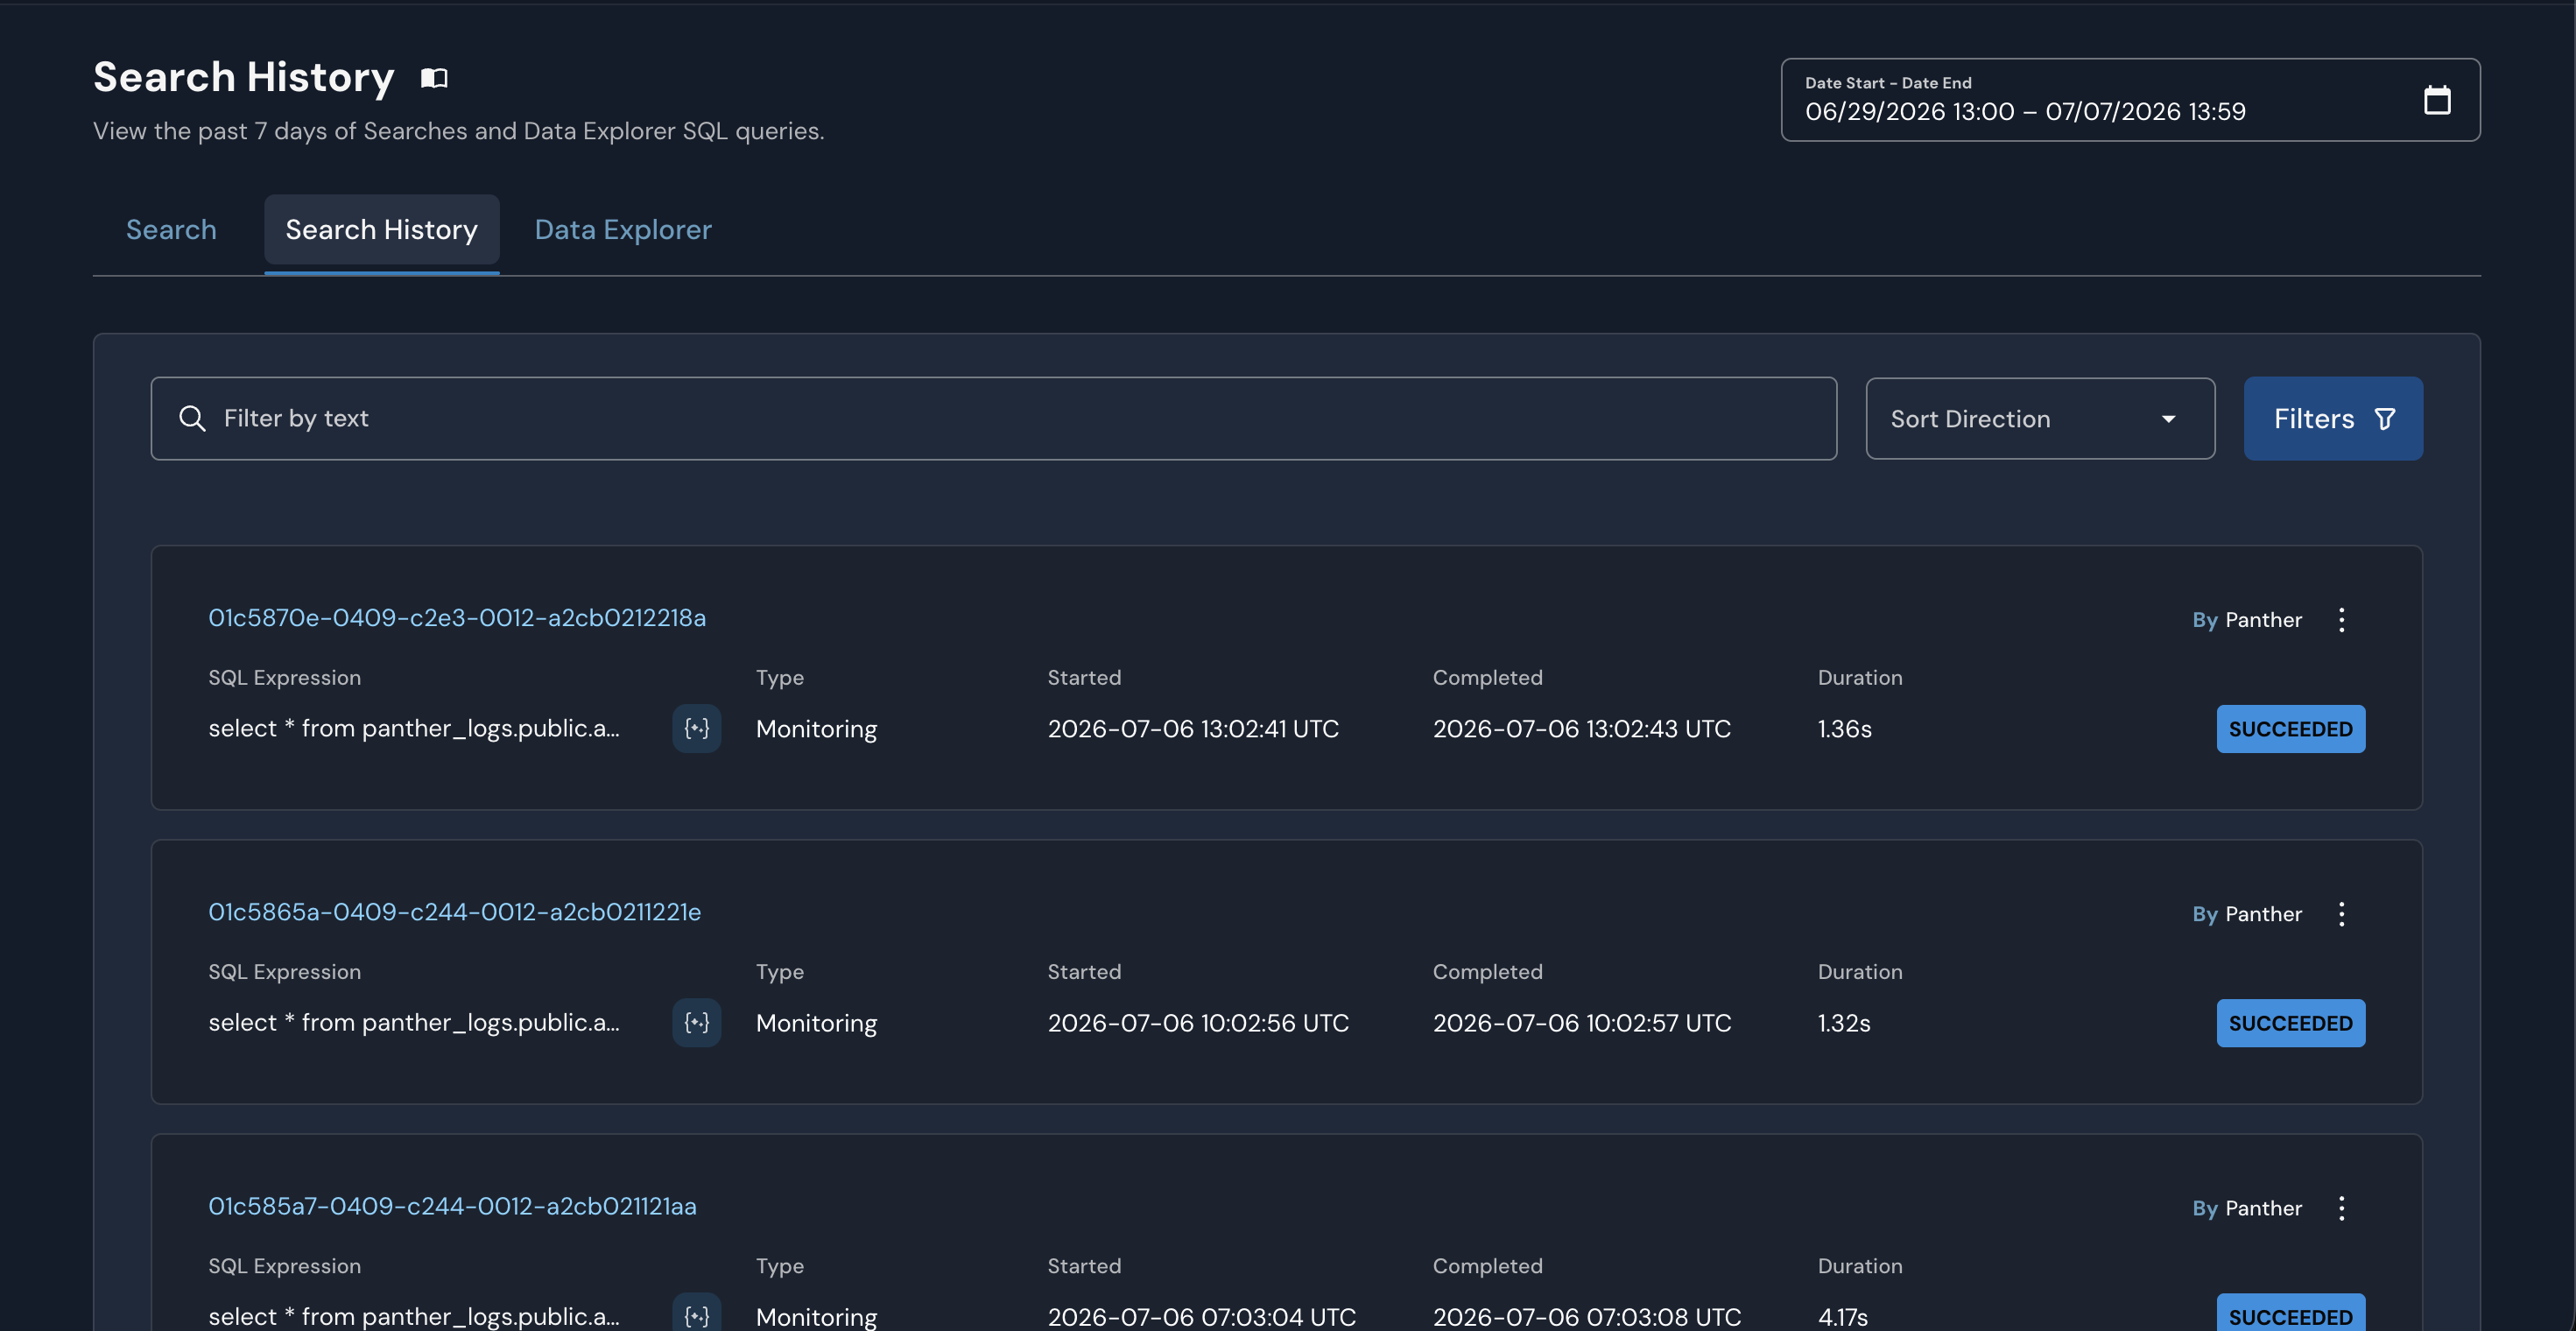
The Search History page gives you visibility into what queries are running or recently ran in your Panther instance. It displays the last 30 days of searches run in the Panther Console.
## How to access Search History
1. In the left-hand navigation bar of your Panther Console, click **Search**, then select the **Search History** tab.
2. Click on a search name.
* This will redirect you to [Data Explorer](/search/data-explorer.md) or [Search](/search/search-tool.md), where the query will automatically run. When the search is finished running, you can view the results at the bottom of the page.
### Details included in Search History
In the search history, you'll see the following details:
* A search name or UUID
* The SQL or [PantherFlow](/pantherflow.md) expression it ran or attempted to run
* The search type. The possible search types are:
* **Ad Hoc**: This is most commonly logged when a user runs a query in Data Explorer.
* **Alert Detail** and **Alert Summary**: This is populated when a user looks at details and summary pages of an alert.
* **PantherFlow Search**: A [PantherFlow](/pantherflow.md) query run in the [Search](/search/search-tool.md) tool.
* **Scheduled**: A [Scheduled Search](/search/scheduled-searches.md), run by the database-specific API.
* **Search**: Searches run in the [Search](/search/search-tool.md) tool.
* The timestamp when the query started and stopped.
* The query status: **Succeeded**, **Failed**, **Cancelled** or **Running**.
* The user or Panther process running the query.
## How to cancel a running search
1. From the Search History page, click a query name.
* This will redirect you to Data Explorer where the query will automatically run.
2. While viewing the running query in Data Explorer, click **Cancel** below the query.\

Note that the **Cancel** option will only appear on a query that is currently running.
---
# Agent Instructions
This documentation is published with GitBook. GitBook is the documentation platform designed so that both humans and AI agents can read, navigate, and reason over technical content effectively. Learn more at gitbook.com.
## Querying This Documentation
If you need additional information that is not directly available in this page, you can query the documentation dynamically by asking a question.
Perform an HTTP GET request on the current page URL with the `ask` query parameter, and the optional `goal` query parameter:
```
GET https://docs.panther.com/search/search-history.md?ask=&goal=
```
`ask` is the immediate question: it should be specific, self-contained, and written in natural language.
`goal` is optional and describes the broader end goal you are ultimately trying to accomplish on behalf of the user. GitBook uses it to tailor the answer towards what is most useful for that goal.
The response will contain a direct answer to the question and relevant excerpts and sources from the documentation.
Use this mechanism when the answer is not explicitly present in the current page, you need clarification or additional context, or you want to retrieve related documentation sections.