LogoLogo
Knowledge BaseCommunityRelease NotesRequest Demo
  • Overview
  • Quick Start
    • Onboarding Guide
  • Data Sources & Transports
    • Supported Logs
      • 1Password Logs
      • Apache Logs
      • AppOmni Logs
      • Asana Logs
      • Atlassian Logs
      • Auditd Logs
      • Auth0 Logs
      • AWS Logs
        • AWS ALB
        • AWS Aurora
        • AWS CloudFront
        • AWS CloudTrail
        • AWS CloudWatch
        • AWS Config
        • AWS EKS
        • AWS GuardDuty
        • AWS Security Hub
        • Amazon Security Lake
        • AWS S3
        • AWS Transit Gateway
        • AWS VPC
        • AWS WAF
      • Azure Monitor Logs
      • Bitwarden Logs
      • Box Logs
      • Carbon Black Logs
      • Cisco Umbrella Logs
      • Cloudflare Logs
      • CrowdStrike Logs
        • CrowdStrike Falcon Data Replicator
        • CrowdStrike Event Streams
      • Docker Logs
      • Dropbox Logs
      • Duo Security Logs
      • Envoy Logs
      • Fastly Logs
      • Fluentd Logs
      • GCP Logs
      • GitHub Logs
      • GitLab Logs
      • Google Workspace Logs
      • Heroku Logs
      • Jamf Pro Logs
      • Juniper Logs
      • Lacework Logs
        • Lacework Alert Channel Webhook
        • Lacework Export
      • Material Security Logs
      • Microsoft 365 Logs
      • Microsoft Entra ID Audit Logs
      • Microsoft Graph Logs
      • MongoDB Atlas Logs
      • Netskope Logs
      • Nginx Logs
      • Notion Logs
      • Okta Logs
      • OneLogin Logs
      • Orca Security Logs (Beta)
      • Osquery Logs
      • OSSEC Logs
      • Proofpoint Logs
      • Push Security Logs
      • Rapid7 Logs
      • Salesforce Logs
      • SentinelOne Logs
      • Slack Logs
      • Snowflake Audit Logs (Beta)
      • Snyk Logs
      • Sophos Logs
      • Sublime Security Logs
      • Suricata Logs
      • Sysdig Logs
      • Syslog Logs
      • Tailscale Logs
      • Teleport Logs
      • Tenable Vulnerability Management Logs
      • Thinkst Canary Logs
      • Tines Logs
      • Tracebit Logs
      • Windows Event Logs
      • Wiz Logs
      • Zeek Logs
      • Zendesk Logs
      • Zoom Logs
      • Zscaler Logs
        • Zscaler ZIA
        • Zscaler ZPA
    • Custom Logs
      • Log Schema Reference
      • Transformations
      • Script Log Parser (Beta)
      • Fastmatch Log Parser
      • Regex Log Parser
      • CSV Log Parser
    • Data Transports
      • HTTP Source
      • AWS Sources
        • S3 Source
        • CloudWatch Logs Source
        • SQS Source
          • SNS Source
        • EventBridge
      • Google Cloud Sources
        • Cloud Storage (GCS) Source
        • Pub/Sub Source
      • Azure Blob Storage Source
    • Monitoring Log Sources
    • Ingestion Filters
      • Raw Event Filters
      • Normalized Event Filters (Beta)
    • Data Pipeline Tools
      • Chronosphere Onboarding Guide
      • Cribl Onboarding Guide
      • Fluent Bit Onboarding Guide
        • Fluent Bit Configuration Examples
      • Fluentd Onboarding Guide
        • General log forwarding via Fluentd
        • MacOS System Logs to S3 via Fluentd
        • Syslog to S3 via Fluentd
        • Windows Event Logs to S3 via Fluentd (Legacy)
        • GCP Audit to S3 via Fluentd
      • Observo Onboarding Guide
      • Tarsal Onboarding Guide
    • Tech Partner Log Source Integrations
  • Detections
    • Using Panther-managed Detections
      • Detection Packs
    • Rules and Scheduled Rules
      • Writing Python Detections
        • Python Rule Caching
        • Data Models
        • Global Helper Functions
      • Modifying Detections with Inline Filters (Beta)
      • Derived Detections (Beta)
        • Using Derived Detections to Avoid Merge Conflicts
      • Using the Simple Detection Builder
      • Writing Simple Detections
        • Simple Detection Match Expression Reference
        • Simple Detection Error Codes
    • Correlation Rules (Beta)
      • Correlation Rule Reference
    • PyPanther Detections (Beta)
      • Creating PyPanther Detections
      • Registering, Testing, and Uploading PyPanther Detections
      • Managing PyPanther Detections in the Panther Console
      • PyPanther Detections Style Guide
      • pypanther Library Reference
      • Using the pypanther Command Line Tool
    • Signals
    • Policies
    • Testing
      • Data Replay (Beta)
    • Framework Mapping and MITRE ATT&CKĀ® Matrix
  • Cloud Security Scanning
    • Cloud Resource Attributes
      • AWS
        • ACM Certificate
        • CloudFormation Stack
        • CloudWatch Log Group
        • CloudTrail
        • CloudTrail Meta
        • Config Recorder
        • Config Recorder Meta
        • DynamoDB Table
        • EC2 AMI
        • EC2 Instance
        • EC2 Network ACL
        • EC2 SecurityGroup
        • EC2 Volume
        • EC2 VPC
        • ECS Cluster
        • EKS Cluster
        • ELBV2 Application Load Balancer
        • GuardDuty Detector
        • GuardDuty Detector Meta
        • IAM Group
        • IAM Policy
        • IAM Role
        • IAM Root User
        • IAM User
        • KMS Key
        • Lambda Function
        • Password Policy
        • RDS Instance
        • Redshift Cluster
        • Route 53 Domains
        • Route 53 Hosted Zone
        • S3 Bucket
        • WAF Web ACL
  • Alerts & Destinations
    • Alert Destinations
      • Amazon SNS Destination
      • Amazon SQS Destination
      • Asana Destination
      • Blink Ops Destination
      • Custom Webhook Destination
      • Discord Destination
      • GitHub Destination
      • Google Pub/Sub Destination (Beta)
      • Incident.io Destination
      • Jira Cloud Destination
      • Jira Data Center Destination (Beta)
      • Microsoft Teams Destination
      • Mindflow Destination
      • OpsGenie Destination
      • PagerDuty Destination
      • Rapid7 Destination
      • ServiceNow Destination (Custom Webhook)
      • Slack Bot Destination
      • Slack Destination (Webhook)
      • Splunk Destination (Beta)
      • Tines Destination
      • Torq Destination
    • Assigning and Managing Alerts
      • Managing Alerts in Slack
    • Alert Runbooks
      • Panther-managed Policies Runbooks
        • AWS CloudTrail Is Enabled In All Regions
        • AWS CloudTrail Sending To CloudWatch Logs
        • AWS KMS CMK Key Rotation Is Enabled
        • AWS Application Load Balancer Has Web ACL
        • AWS Access Keys Are Used Every 90 Days
        • AWS Access Keys are Rotated Every 90 Days
        • AWS ACM Certificate Is Not Expired
        • AWS Access Keys not Created During Account Creation
        • AWS CloudTrail Has Log Validation Enabled
        • AWS CloudTrail S3 Bucket Has Access Logging Enabled
        • AWS CloudTrail Logs S3 Bucket Not Publicly Accessible
        • AWS Config Is Enabled for Global Resources
        • AWS DynamoDB Table Has Autoscaling Targets Configured
        • AWS DynamoDB Table Has Autoscaling Enabled
        • AWS DynamoDB Table Has Encryption Enabled
        • AWS EC2 AMI Launched on Approved Host
        • AWS EC2 AMI Launched on Approved Instance Type
        • AWS EC2 AMI Launched With Approved Tenancy
        • AWS EC2 Instance Has Detailed Monitoring Enabled
        • AWS EC2 Instance Is EBS Optimized
        • AWS EC2 Instance Running on Approved AMI
        • AWS EC2 Instance Running on Approved Instance Type
        • AWS EC2 Instance Running in Approved VPC
        • AWS EC2 Instance Running On Approved Host
        • AWS EC2 Instance Running With Approved Tenancy
        • AWS EC2 Instance Volumes Are Encrypted
        • AWS EC2 Volume Is Encrypted
        • AWS GuardDuty is Logging to a Master Account
        • AWS GuardDuty Is Enabled
        • AWS IAM Group Has Users
        • AWS IAM Policy Blocklist Is Respected
        • AWS IAM Policy Does Not Grant Full Administrative Privileges
        • AWS IAM Policy Is Not Assigned Directly To User
        • AWS IAM Policy Role Mapping Is Respected
        • AWS IAM User Has MFA Enabled
        • AWS IAM Password Used Every 90 Days
        • AWS Password Policy Enforces Complexity Guidelines
        • AWS Password Policy Enforces Password Age Limit Of 90 Days Or Less
        • AWS Password Policy Prevents Password Reuse
        • AWS RDS Instance Is Not Publicly Accessible
        • AWS RDS Instance Snapshots Are Not Publicly Accessible
        • AWS RDS Instance Has Storage Encrypted
        • AWS RDS Instance Has Backups Enabled
        • AWS RDS Instance Has High Availability Configured
        • AWS Redshift Cluster Allows Version Upgrades
        • AWS Redshift Cluster Has Encryption Enabled
        • AWS Redshift Cluster Has Logging Enabled
        • AWS Redshift Cluster Has Correct Preferred Maintenance Window
        • AWS Redshift Cluster Has Sufficient Snapshot Retention Period
        • AWS Resource Has Minimum Number of Tags
        • AWS Resource Has Required Tags
        • AWS Root Account Has MFA Enabled
        • AWS Root Account Does Not Have Access Keys
        • AWS S3 Bucket Name Has No Periods
        • AWS S3 Bucket Not Publicly Readable
        • AWS S3 Bucket Not Publicly Writeable
        • AWS S3 Bucket Policy Does Not Use Allow With Not Principal
        • AWS S3 Bucket Policy Enforces Secure Access
        • AWS S3 Bucket Policy Restricts Allowed Actions
        • AWS S3 Bucket Policy Restricts Principal
        • AWS S3 Bucket Has Versioning Enabled
        • AWS S3 Bucket Has Encryption Enabled
        • AWS S3 Bucket Lifecycle Configuration Expires Data
        • AWS S3 Bucket Has Logging Enabled
        • AWS S3 Bucket Has MFA Delete Enabled
        • AWS S3 Bucket Has Public Access Block Enabled
        • AWS Security Group Restricts Ingress On Administrative Ports
        • AWS VPC Default Security Group Restricts All Traffic
        • AWS VPC Flow Logging Enabled
        • AWS WAF Has Correct Rule Ordering
        • AWS CloudTrail Logs Encrypted Using KMS CMK
      • Panther-managed Rules Runbooks
        • AWS CloudTrail Modified
        • AWS Config Service Modified
        • AWS Console Login Failed
        • AWS Console Login Without MFA
        • AWS EC2 Gateway Modified
        • AWS EC2 Network ACL Modified
        • AWS EC2 Route Table Modified
        • AWS EC2 SecurityGroup Modified
        • AWS EC2 VPC Modified
        • AWS IAM Policy Modified
        • AWS KMS CMK Loss
        • AWS Root Activity
        • AWS S3 Bucket Policy Modified
        • AWS Unauthorized API Call
    • Tech Partner Alert Destination Integrations
  • Investigations & Search
    • Search
      • Search Filter Operators
    • Data Explorer
      • Data Explorer SQL Search Examples
        • CloudTrail logs queries
        • GitHub Audit logs queries
        • GuardDuty logs queries
        • Nginx and ALB Access logs queries
        • Okta logs queries
        • S3 Access logs queries
        • VPC logs queries
    • Visualization and Dashboards
      • Custom Dashboards (Beta)
      • Panther-Managed Dashboards
    • Standard Fields
    • Saved and Scheduled Searches
      • Templated Searches
        • Behavioral Analytics and Anomaly Detection Template Macros (Beta)
      • Scheduled Search Examples
    • Search History
    • Data Lakes
      • Snowflake
        • Snowflake Configuration for Optimal Search Performance
      • Athena
  • PantherFlow (Beta)
    • PantherFlow Quick Reference
    • PantherFlow Statements
    • PantherFlow Operators
      • Datatable Operator
      • Extend Operator
      • Join Operator
      • Limit Operator
      • Project Operator
      • Range Operator
      • Sort Operator
      • Search Operator
      • Summarize Operator
      • Union Operator
      • Visualize Operator
      • Where Operator
    • PantherFlow Data Types
    • PantherFlow Expressions
    • PantherFlow Functions
      • Aggregation Functions
      • Date/time Functions
      • String Functions
      • Array Functions
      • Math Functions
      • Control Flow Functions
      • Regular Expression Functions
      • Snowflake Functions
      • Data Type Functions
      • Other Functions
    • PantherFlow Example Queries
      • PantherFlow Examples: Threat Hunting Scenarios
      • PantherFlow Examples: SOC Operations
      • PantherFlow Examples: Panther Audit Logs
  • Enrichment
    • Custom Lookup Tables
      • Creating a GreyNoise Lookup Table
      • Lookup Table Examples
        • Using Lookup Tables: 1Password UUIDs
      • Lookup Table Specification Reference
    • Identity Provider Profiles
      • Okta Profiles
      • Google Workspace Profiles
    • Anomali ThreatStream
    • IPinfo
    • Tor Exit Nodes
    • TrailDiscover (Beta)
  • Panther AI (Beta)
  • System Configuration
    • Role-Based Access Control
    • Identity & Access Integrations
      • Azure Active Directory SSO
      • Duo SSO
      • G Suite SSO
      • Okta SSO
        • Okta SCIM
      • OneLogin SSO
      • Generic SSO
    • Panther Audit Logs
      • Querying and Writing Detections for Panther Audit Logs
      • Panther Audit Log Actions
    • Notifications and Errors (Beta)
      • System Errors
    • Panther Deployment Types
      • SaaS
      • Cloud Connected
        • Configuring Snowflake for Cloud Connected
        • Configuring AWS for Cloud Connected
        • Pre-Deployment Tools
      • Legacy Configurations
        • Snowflake Connected (Legacy)
        • Customer-configured Snowflake Integration (Legacy)
        • Self-Hosted Deployments (Legacy)
          • Runtime Environment
  • Panther Developer Workflows
    • Panther Developer Workflows Overview
    • Using panther-analysis
      • Public Fork
      • Private Clone
      • Panther Analysis Tool
        • Install, Configure, and Authenticate with the Panther Analysis Tool
        • Panther Analysis Tool Commands
        • Managing Lookup Tables and Enrichment Providers with the Panther Analysis Tool
      • CI/CD for Panther Content
        • Deployment Workflows Using Panther Analysis Tool
          • Managing Panther Content via CircleCI
          • Managing Panther Content via GitHub Actions
        • Migrating to a CI/CD Workflow
    • Panther API
      • REST API (Beta)
        • Alerts
        • Alert Comments
        • API Tokens
        • Data Models
        • Globals
        • Log Sources
        • Queries
        • Roles
        • Rules
        • Scheduled Rules
        • Simple Rules
        • Policies
        • Users
      • GraphQL API
        • Alerts & Errors
        • Cloud Account Management
        • Data Lake Queries
        • Log Source Management
        • Metrics
        • Schemas
        • Token Rotation
        • User & Role Management
      • API Playground
    • Terraform
      • Managing AWS S3 Log Sources with Terraform
      • Managing HTTP Log Sources with Terraform
    • pantherlog Tool
    • Converting Sigma Rules
  • Resources
    • Help
      • Operations
      • Security and Privacy
        • Security Without AWS External ID
      • Glossary
      • Legal
    • Panther System Architecture
Powered by GitBook
On this page
  • Overview
  • Getting started with detections
  • Choose a detection management workflow
  • Enable or write detections
  • Simple Detections
  • Working with your data in detections
  • Signals vs. alerts
  • Detection features

Was this helpful?

Detections

Use detections to analyze data and trigger alerts on suspicious behavior

PreviousTech Partner Log Source IntegrationsNextUsing Panther-managed Detections

Last updated 3 months ago

Was this helpful?

Overview

Detections are segments of logic run over real-time or historical log events, to identify suspicious behavior and generate , and optionally . Your team can leverage detections-as-code by creating detections in Python, or use Panther's features to collaborate on detection creation and management, no matter your level of technical expertise.

There are four types of detections:

  • Rules: Detect suspicious activity in security logs in real-time.

    • In the Console, rules can be created by using the , or by .

    • In the CLI workflow, rules can be written in or .

    For more information, see .

  • Scheduled Rules: Run against results from scheduled queries on your data lake.

    • In the Console, scheduled rules can be created by .

    • In the CLI workflow, scheduled rules can be created by .

    For more information, see .

  • Correlation rules: Detect when a group or sequence of events has occurred.

    • In the Console, correlation rules can be created by .

      • In the CLI workflow, correlation rules can be created by .

    For more information, see .

  • Policies: Scan and evaluate cloud infrastructure configurations to identify misconfigurations.

    • In the Console, policies can be created by .

    • In the CLI workflow, policies can be created by .

    For more information, see .

When there's a match on a rule, scheduled rule, or correlation rule, a signal is created—and, if alerting is enabled, a rule match. Policies, on each match, generate a compliance failure.

Getting started with detections

Choose a detection management workflow

You can create and manage Panther detections using one of the following methods:

  • Panther Console

Migrating to a CI/CD workflow

Enable or write detections

If you'd rather create your own detections from scratch, learn how on the following pages:

Simple Detections

Simple Detections refers to the set of Panther features that makes it easy for users with all levels of technical skill to create and manage detections in Panther. These features include:

Together, these features allow team members with various levels of YAML experience to understand and collaborate on detections.

If you create or edit detections using the Simple Detection builder in the Console, copy the resulting YAML representation and include it in your local detections files, in order to prevent the changes from being overwritten on next upload.

Working with your data in detections

Schema definitions

Panther’s Schemas provide helpful information on the types of fields contained within your data, which makes it easier to understand how to interact with your data when writing a Detection.

Schema definitions can be found in:

  • Panther's documentation

  • The Panther Console

    • Log in to the Panther Console and navigate to Data > Schemas.

Pulling samples out of Data Explorer

Data Explorer makes it easier to understand and investigate data, location of data, and data types when writing Python code. It contains all the data Panther parses from your log sources and stores the data in tables.

Explore and find log events by searching the relevant table for the log type you are interested in writing a detection for.

When the query has produced results, you will see the example log events in the Results table. You can download these as a CSV file.

Signals vs. alerts

Detection features

Simple Detections

Together, these features allow team members with varying levels of technical skill to collaborate on detection management.

Panther-managed Detections
Detection Packs
Inline Filters
Derivation

You can create one or more Derived Detections from a single Base Detection in Panther. Derived Detections inherit the Base Detection's core detection logic, which is immutable, as well as its metadata field values, which can be overwritten for each Derived Detection.

Testing
Data Replay
Caching
Data Models
Global Helper Functions
Framework Mapping

Rule matches can trigger alerts according to the detection's event threshold and deduplication configurations. Alerts are then based on configurations on the detection and destination. Learn more about the .

You'll need to decide whether you'd like to . Then you can get started .

Construct your own detections in the Console using the , or by .

Enable (individually, or in ) to get started quickly, with no additional configuration necessary.

Write detections locally as either or .

Learn more about managing Panther detections using a Continuous Integration and Continuous Deployment workflow in our .

CLI workflows include using , an open source utility for testing, packaging, and deploying Panther detections from source code.

If you use —the set of features that allows users of varying technical skill to create and edit detections—it is possible to use both the Panther Console and the CLI workflow to collaborate on detections, to an extent. Learn more in .

You may want to get started quickly by enabling in the Panther Console, but then later transition to using the CI/CD workflow. (Using both the Console and CI/CD workflows simultaneously is not supported.) To migrate your workflow to CI/CD, follow the instructions on .

The quickest way to start detecting threats with Panther is to turn on the already written that come with your Panther instance. These built-in rules and policies are applicable to various log sources, and Panther periodically releases improvements to their core detection logic. Panther-managed rules can be customized using , or you can clone them and edit the detection logic of the cloned version to suit your exact needs.

It's also possible to quickly generate rules in Panther by .

: In the Panther Console, you can use the Simple Detection builder to create and edit rules without writing code.

: When you write Simple Detections in the CLI workflow (in YAML), then upload them to Panther, they will be represented in the Panther Console in the Simple Detection builder.

If your team uses the CLI workflow to manage detection content, the changes made to detections using the Simple Detection builder in the Console will be overwritten on next upload (except for created in the Console, which will be preserved).

See schemas for each integration within the section of the documentation. Find more information about Custom Log schemas in .

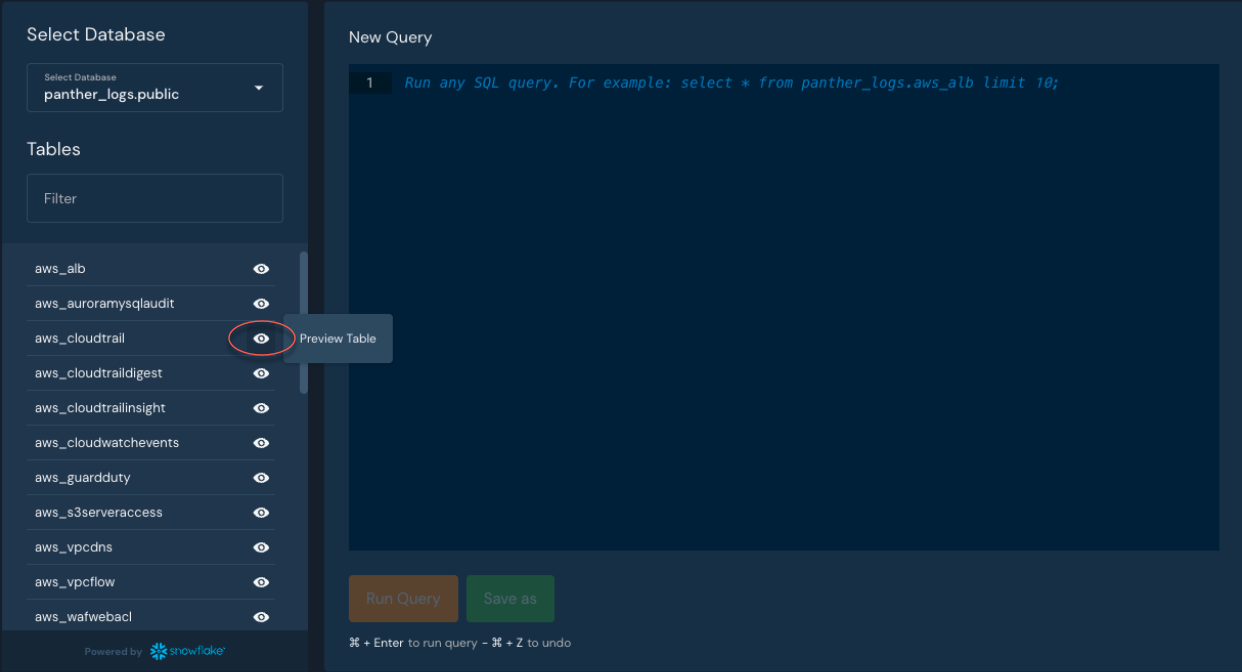
You can without writing SQL. To generate a sample SQL query for that log source, click the eye icon next to the table type:

To copy the log event to be used in while writing detections, click View JSON.

This section previously explained how signals and alerts differ from "rule matches." Panther will stop writing to panther_rule_matches, panther_rule_errors, and panther_views in June 2025. Data written to these locations is already being concurrently written to a new location, and no historical data will be lost. Learn more about the change in .

Each time there is a match on a , , or :

A is generated. This is true regardless of any configuration set on the rule, scheduled rule, or correlation rule.

If the rule, scheduled rule, or correlation rule has alerting enabled (i.e., in the Console, Create Alert is set to ON, or in the CLI workflow CreateAlert is set to true), an is generated (according to the detection's event threshold and deduplication configurations). If alerting is disabled for the detection, an alert is not generated.

Each time there is a match on a , a compliance failure is created (and not a signal). Policies cannot be configured to disable alerting.

Panther's Simple Detections functionality includes the in the Panther Console, and .

Panther comes with a number of Panther-managed detections, which are detections for which Panther has written the core logic, and periodically updates. Using Panther-managed detections saves you the effort of having to write your own, and provides the ongoing benefit of receiving improvements to core detection logic over time, as Panther releases new versions. For more information, see .

Panther packs logically group and update detections via the Panther Console. Detection packs can group any number of Panther features including but not limited to detections, queries, global helpers, data models, or Lookup Tables. packs are defined in this open source repository: . For more information, see .

Inline Filters are conditional statements that are evaluated before a detection's rule function. You can apply Inline Filters to easily tune detections, including . A filter must return true (i.e., match the event) for the rule function, which is written in code, to then be run. Based on the detection's log type, you can select a field to filter on. From there, you will specify the operator and, if applicable, input a value. To learn more, see .

Learn more on .

Panther's detection testing ensures that detections behave as expected and generate alerts once deployed correctly. Test inputs are utilized to determine whether or not an alert will generate in order to promote reliability as code evolves and protect against regressions. For more information, see

Data Replay (Beta) allows rules to be tested against historical log data to preview the outcome of a rule before enabling it. Data Replay can simulate what types of alerts you are likely to receive before deploying the detection. For more information, see .

Panther examines events one-by-one and provides a way to cache results across invocations. To accommodate stateful checks, Panther rules can cache values by using built-in helper functions. For more information, see

Panther's data models provide a way to configure a set of unified fields across all log types. Data models allow you to monitor particular fields across many log types at once, avoiding cumbersome and complex individual log monitoring. For more information, see .

Panther supports the common programming pattern to extract repeated code into helper functions, via the global analysis type. Import global helper functions in your detections by inserting certain commands at the top of your analysis function body then calling the global function as if it were any other Python library. For more information, see .

Panther supports the ability to map rules, policies, and scheduled rules to compliance frameworks (including Ā®) to track coverage against that framework. Reports can be mapped to your detection within the Detections > All Detections navigation section of the Panther Console. For more information, see .

Simple Detection builder
writing Python
Panther-managed Python detections
Detection Packs
Panther CLI workflow
Simple Detections
Python detections
CI/CD Guide
Panther Analysis Tool (PAT)
Panther-managed detections
Rule Filters
converting Sigma rules
Using the Simple Detection Builder
Writing Simple Detections
Writing Python Detections
Simple Detection builder
Simple Detections written in the CLI workflow
Inline Filters
Supported Logs
Custom Logs
preview example table data
Unit Tests
this Knowledge Base article
rule
scheduled rule
correlation rule
signal
alert
policy
Simple Detection builder
Simple Detections in the CLI workflow
Using Panther-managed detections
panther-labs/panther-analysis
Detection Packs
Derived Detections
Testing.
Data Replay
Caching.
Data Models
Global Helper Functions
MITRE ATT&CK
Framework Mapping and MITRE ATT&CKĀ® Matrix
manage your detections in the Panther Console or using the CLI workflow
enabling Panther-managed detections, or writing your own
Simple Detections
Simple Detections
Migrating to a CI/CD Workflow
Panther-managed Detection Packs
Modifying Detections with Inline Filters
Panther-managed ones
signals
alerts
Simple Detection builder
writing Python
Simple Detections YAML
Python
Rules and Scheduled Rules
writing Python
writing Python
Rules and Scheduled Rules
Correlation Rules
writing Python
writing Python
Policies
Simple Detections
difference between signals, rule matches, and alerts below
routed to destinations
writing YAML
writing YAML
Correlation Rules
The eye icon is circled next to a table type on the left side of Data Explorer